View Traces in SigNoz
This page shows how you can use distributed tracing to retrieve detailed telemetry data and see how your applications are performing. You’ll learn the following:
- What is distributed tracing
- How to visualize aggregate metrics from traces
- How to filter your spans
- How to inspect a span
This section uses the HotR.O.D sample application that comes preinstalled with SigNoz and generates sample data that you can query. You can apply the concepts and techniques you’ll learn to monitor your own applications.
Prerequisites
- This section assumes that your application is already instrumented. For details about how you can instrument your application, see the Instrument Your Application section.
- This section assumes that you are familiar with the basics of monitoring applications.
What is Distributed Tracing?
Transaction tracing is a method of monitoring a request across various components of your application. Each request is assigned a unique identifier that is used to track it across every component of your application, allowing you to see which particular instance of a function is slow or failing.
In distributed architectures, a service can run on different virtual machines or containers. Distributed tracing is a method that allows you to monitor applications across different virtual machines or containers.
A distributed trace starts when a user initiates an action. For example, when a user adds an item to their cart, a unique identifier named “parent span” is assigned to that request. As adding an item to the cart is comprised of several individual steps such as querying the database or making external API calls, each of these steps retains the parent identifier and is also assigned a unique identifier named “child span”. For more details about distributed tracing, see the Spans - a key concept of distributed tracing and What is Context Propagation in Distributed Tracing? blog posts.
On the Traces page, you can view and analyze requests as they propagate through various components of your application and get visibility into the experience of your users.
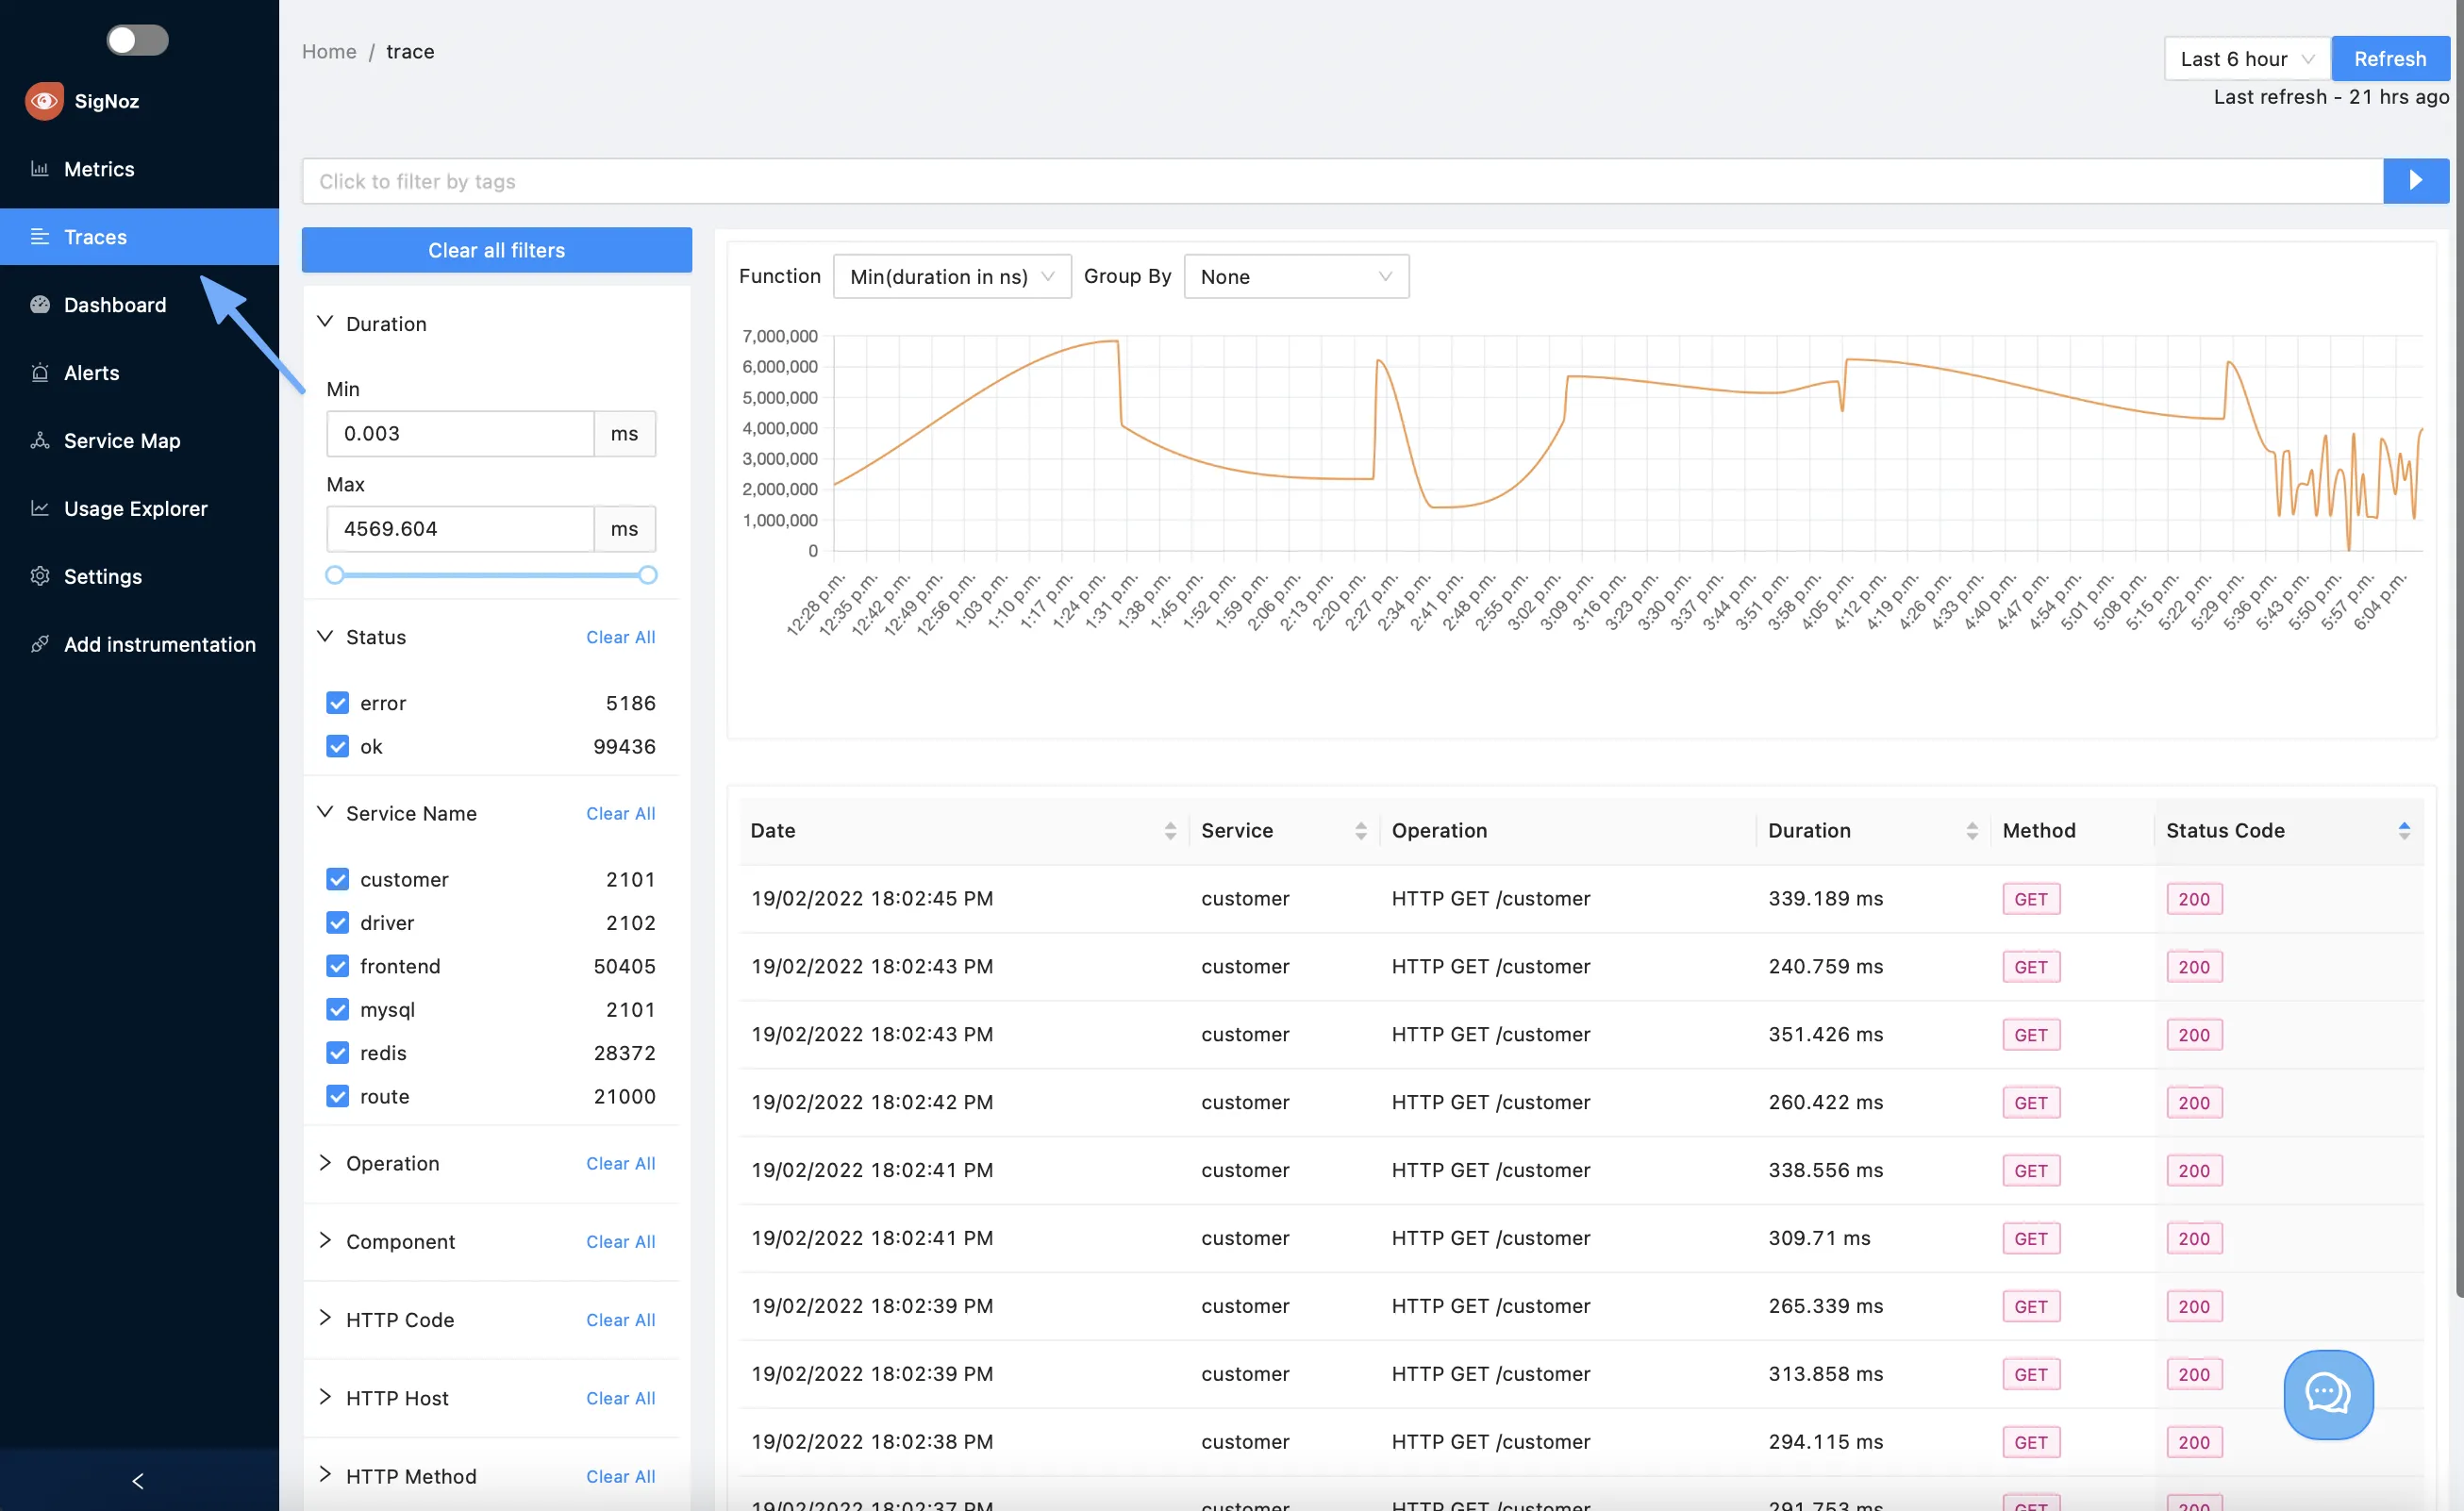
Open the Traces Section
From the sidebar, select Traces:

Visualize Aggregate Metrics from Traces
SigNoz allows you to see aggregates of your filtered traces. The following functions are available for calculating aggregate values:
- Count
- Rate per second
- Sum
- Average
- Max
- Min
- 50th percentile
- 90th percentile
- 95th percentile
- 99th percentile
To specify the function you wish to graph and indicate how the system should group data, you must use the dropdown list to select a function from the list, and then use the Group By clause to break the results into separate data series. The following example screenshot shows how you can plot the number of invocations for each of your services:

Filter Spans by Tags/Attributes
Tags/Attributes are key-value pairs that allow you to filter spans by their characteristics. SigNoz supports multi-selection criterion. And the characteristics include, but are not limited to HTTP headers, DB systems, and Messaging destinations etc. For exhaustive list please refer to OpenTelemetry’s semantic conventions described on the Trace Semantic Conventions page of the OpenTelemetry specification.
There are two ways in which you can filter traces by tags:
- You can enter plain text in the Quick Filter input box and then select the Run button at the far right. Note that text is interpreted as case-sensitive.
- You can use the expression builder. To access the expression builder, select the Add Tags Filter button. Then, use the dropdown list to select a tag from the list of supported tags, specify an operator and enter a value. When you’ve finished, select the Run Query button.
Advanced Filtering Feature
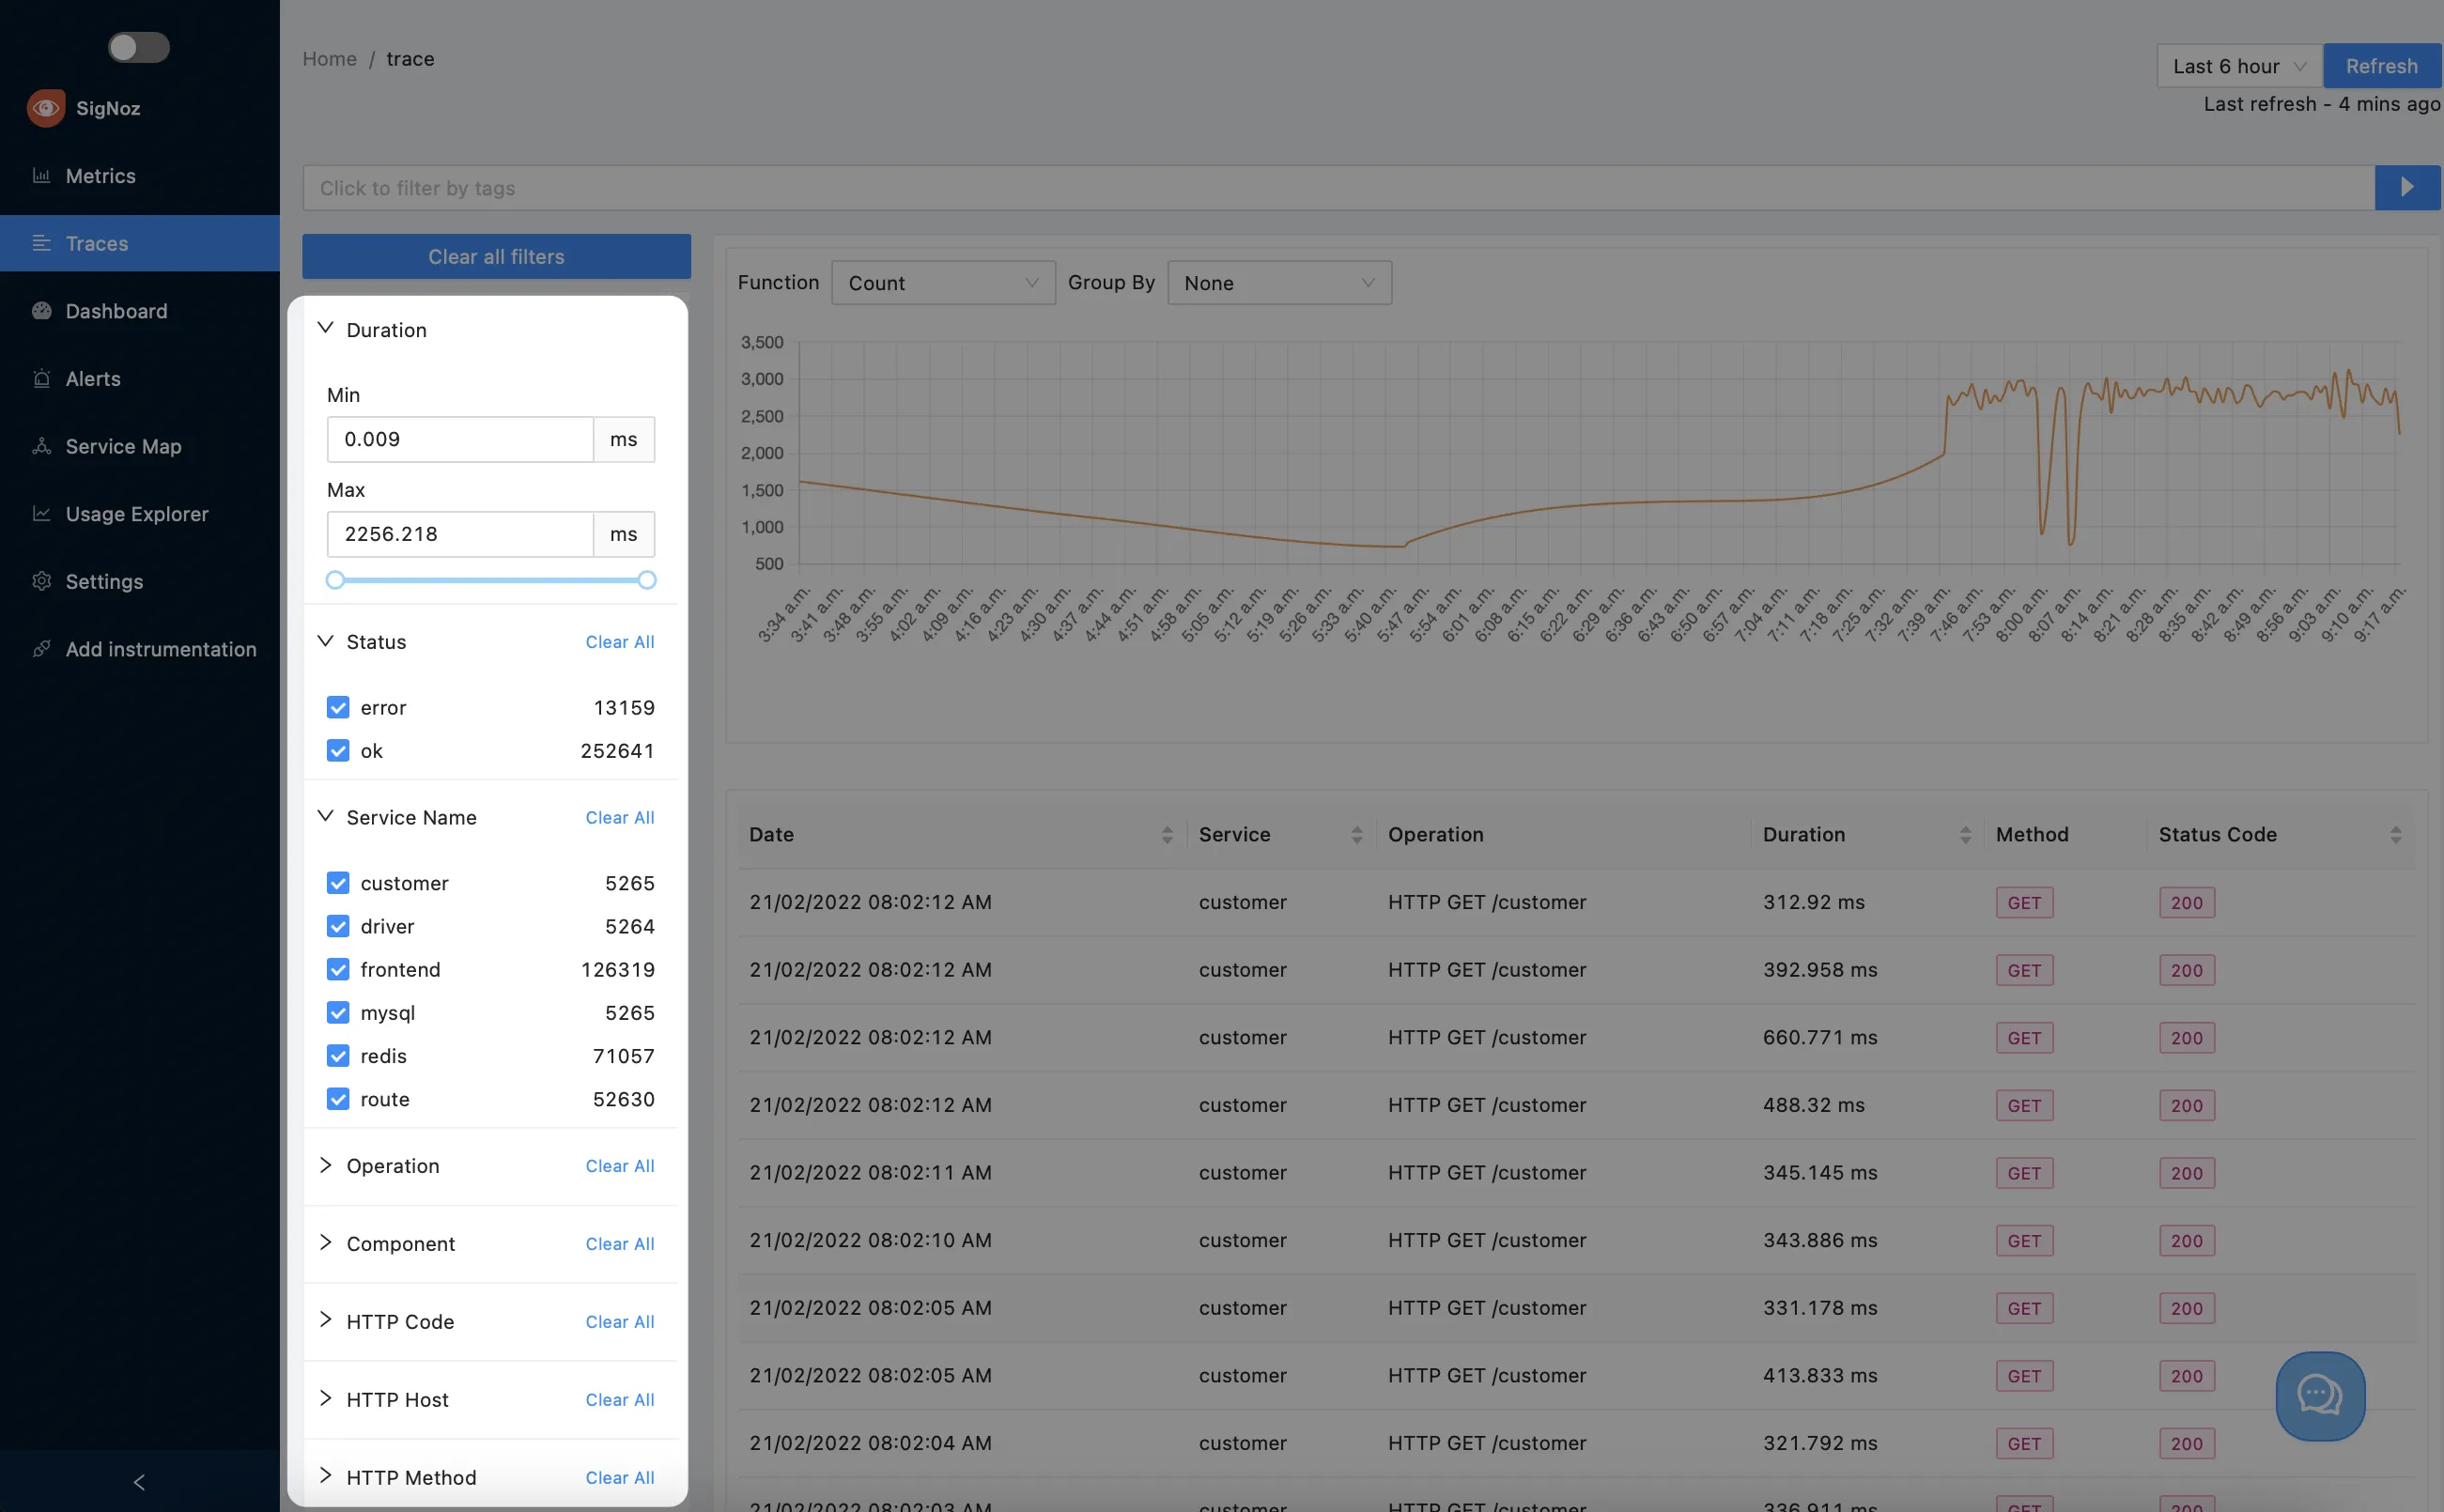
You can use the Advanced Filtering pane that contains multiple filter criteria that you can apply to your spans:

Sort Spans by various tags
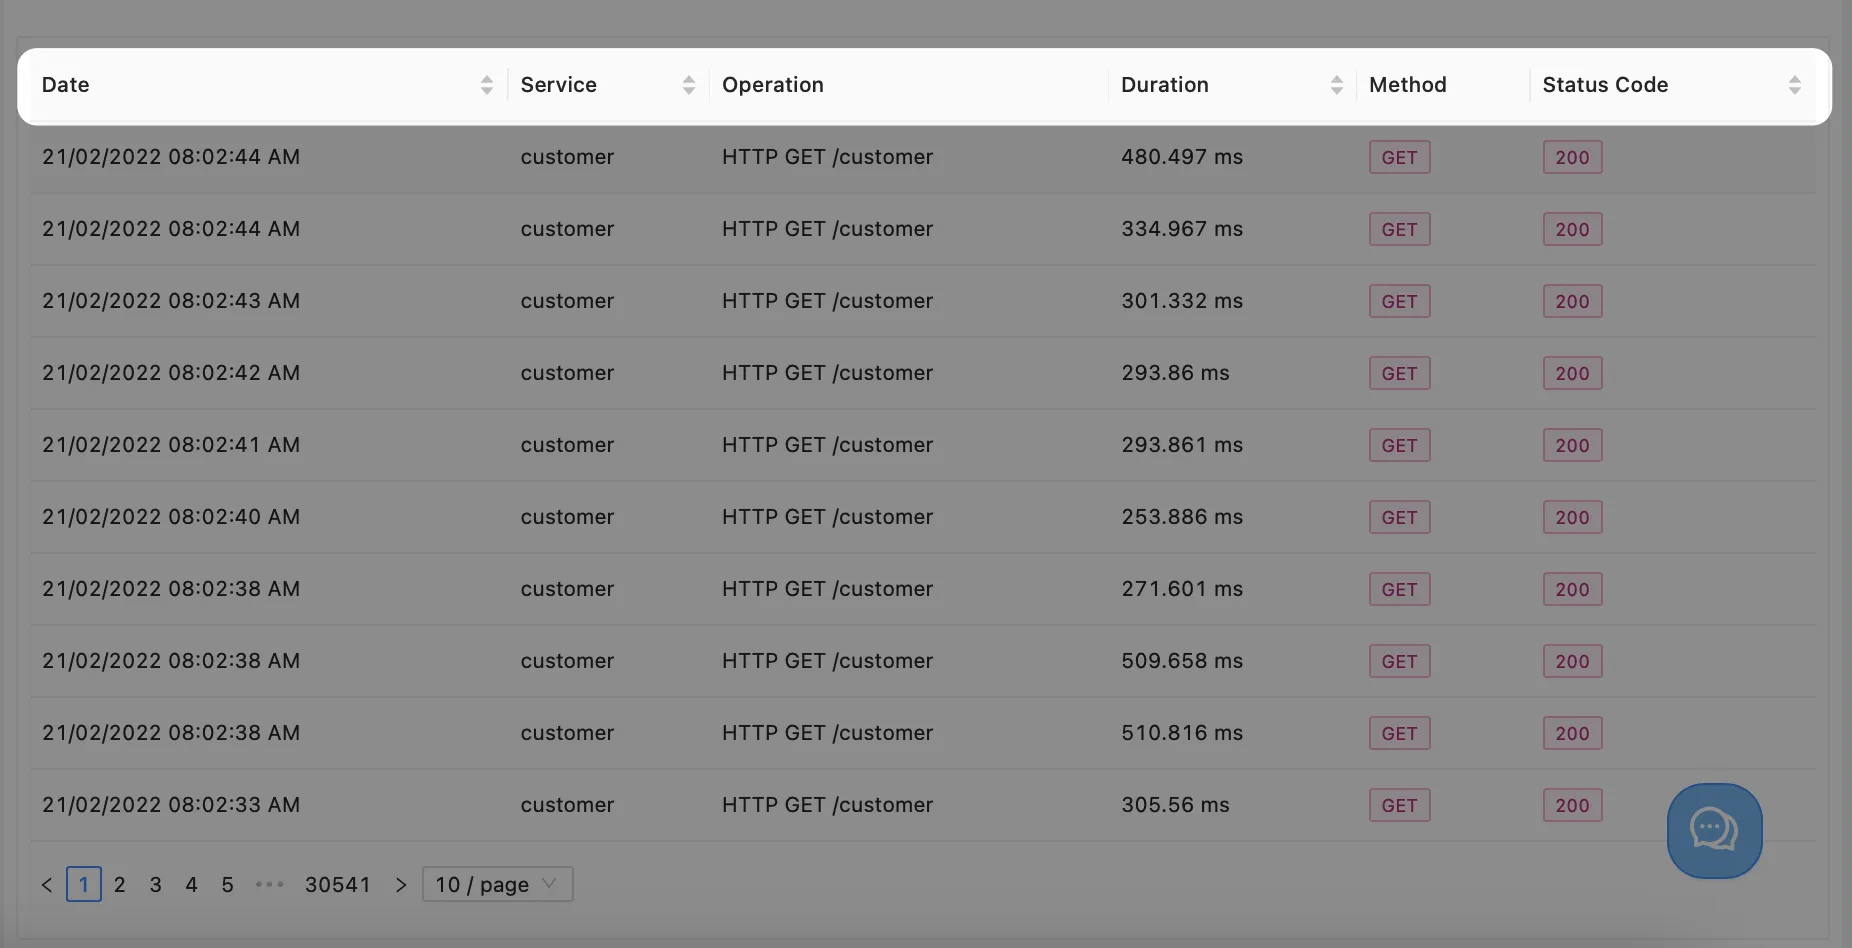
Select a column heading to sort the list by the values in that column. Select the column heading again to reverse the sort order or to cancel sorting:

Inspect a Span
To further troubleshoot your application, you can select a span from the list to view its details. For details, see the Span Details page.
Missing Spans
If you are seeing missing spans in your traces, it could be due to the following reasons:
One of the service is instrumented but not sending spans to SigNoz. For example, the service might not be exporting spans to SigNoz.
The spans are not being sent to SigNoz. For example, the spans might be dropped due to network issues or the spans might be dropped due to sampling.
Span Gaps
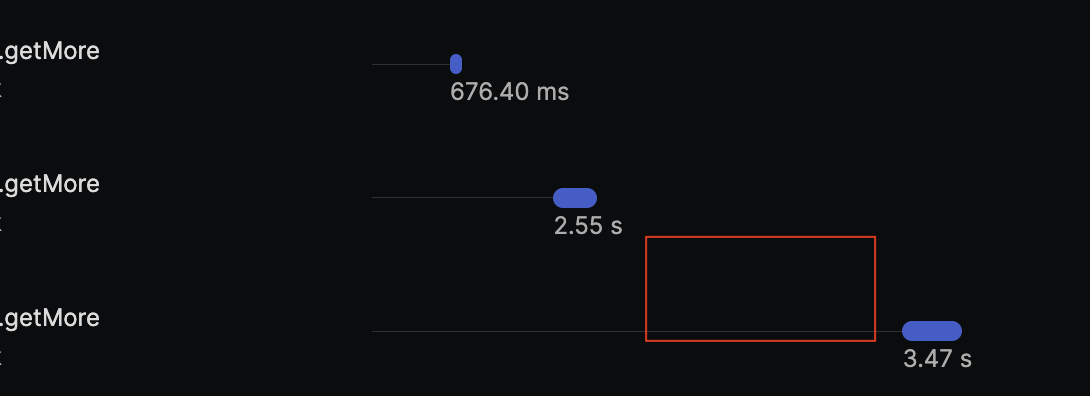
Sometimes it's possible that there are gaps between consequent spans. This happens when some process/code are not traced. For Example, by default OpenTelemetry auto instrumentation libraries do not trace the custom functions/methods. This can be fixed by adding manual instrumentation to the code.
Example of span gaps:

Get Help
If you need help with the steps in this topic, please reach out to us on SigNoz Community Slack.
If you are a SigNoz Cloud user, please use in product chat support located at the bottom right corner of your SigNoz instance or contact us at cloud-support@signoz.io.