Span Details
On the Span Details page, SigNoz displays all the spans associated with the current trace. Spans are displayed in two ways:
- As a flame graph. For an introduction to flame graphs, see Brendan Gregg’s page.
- As Gantt chart. This helps you visualize your spans as a parent-child tree.
For each span, SigNoz shows the following details:
- The name of the operation
- The name of the service
- Start time
- Duration
- The list of tags associated with the currently selected span.
- The list of events associated with the currently selected span. If your application emits events to complement traces, SigNoz will display them on this page. For details about raising events in your code, see the Events section of the OpenTelemetry website
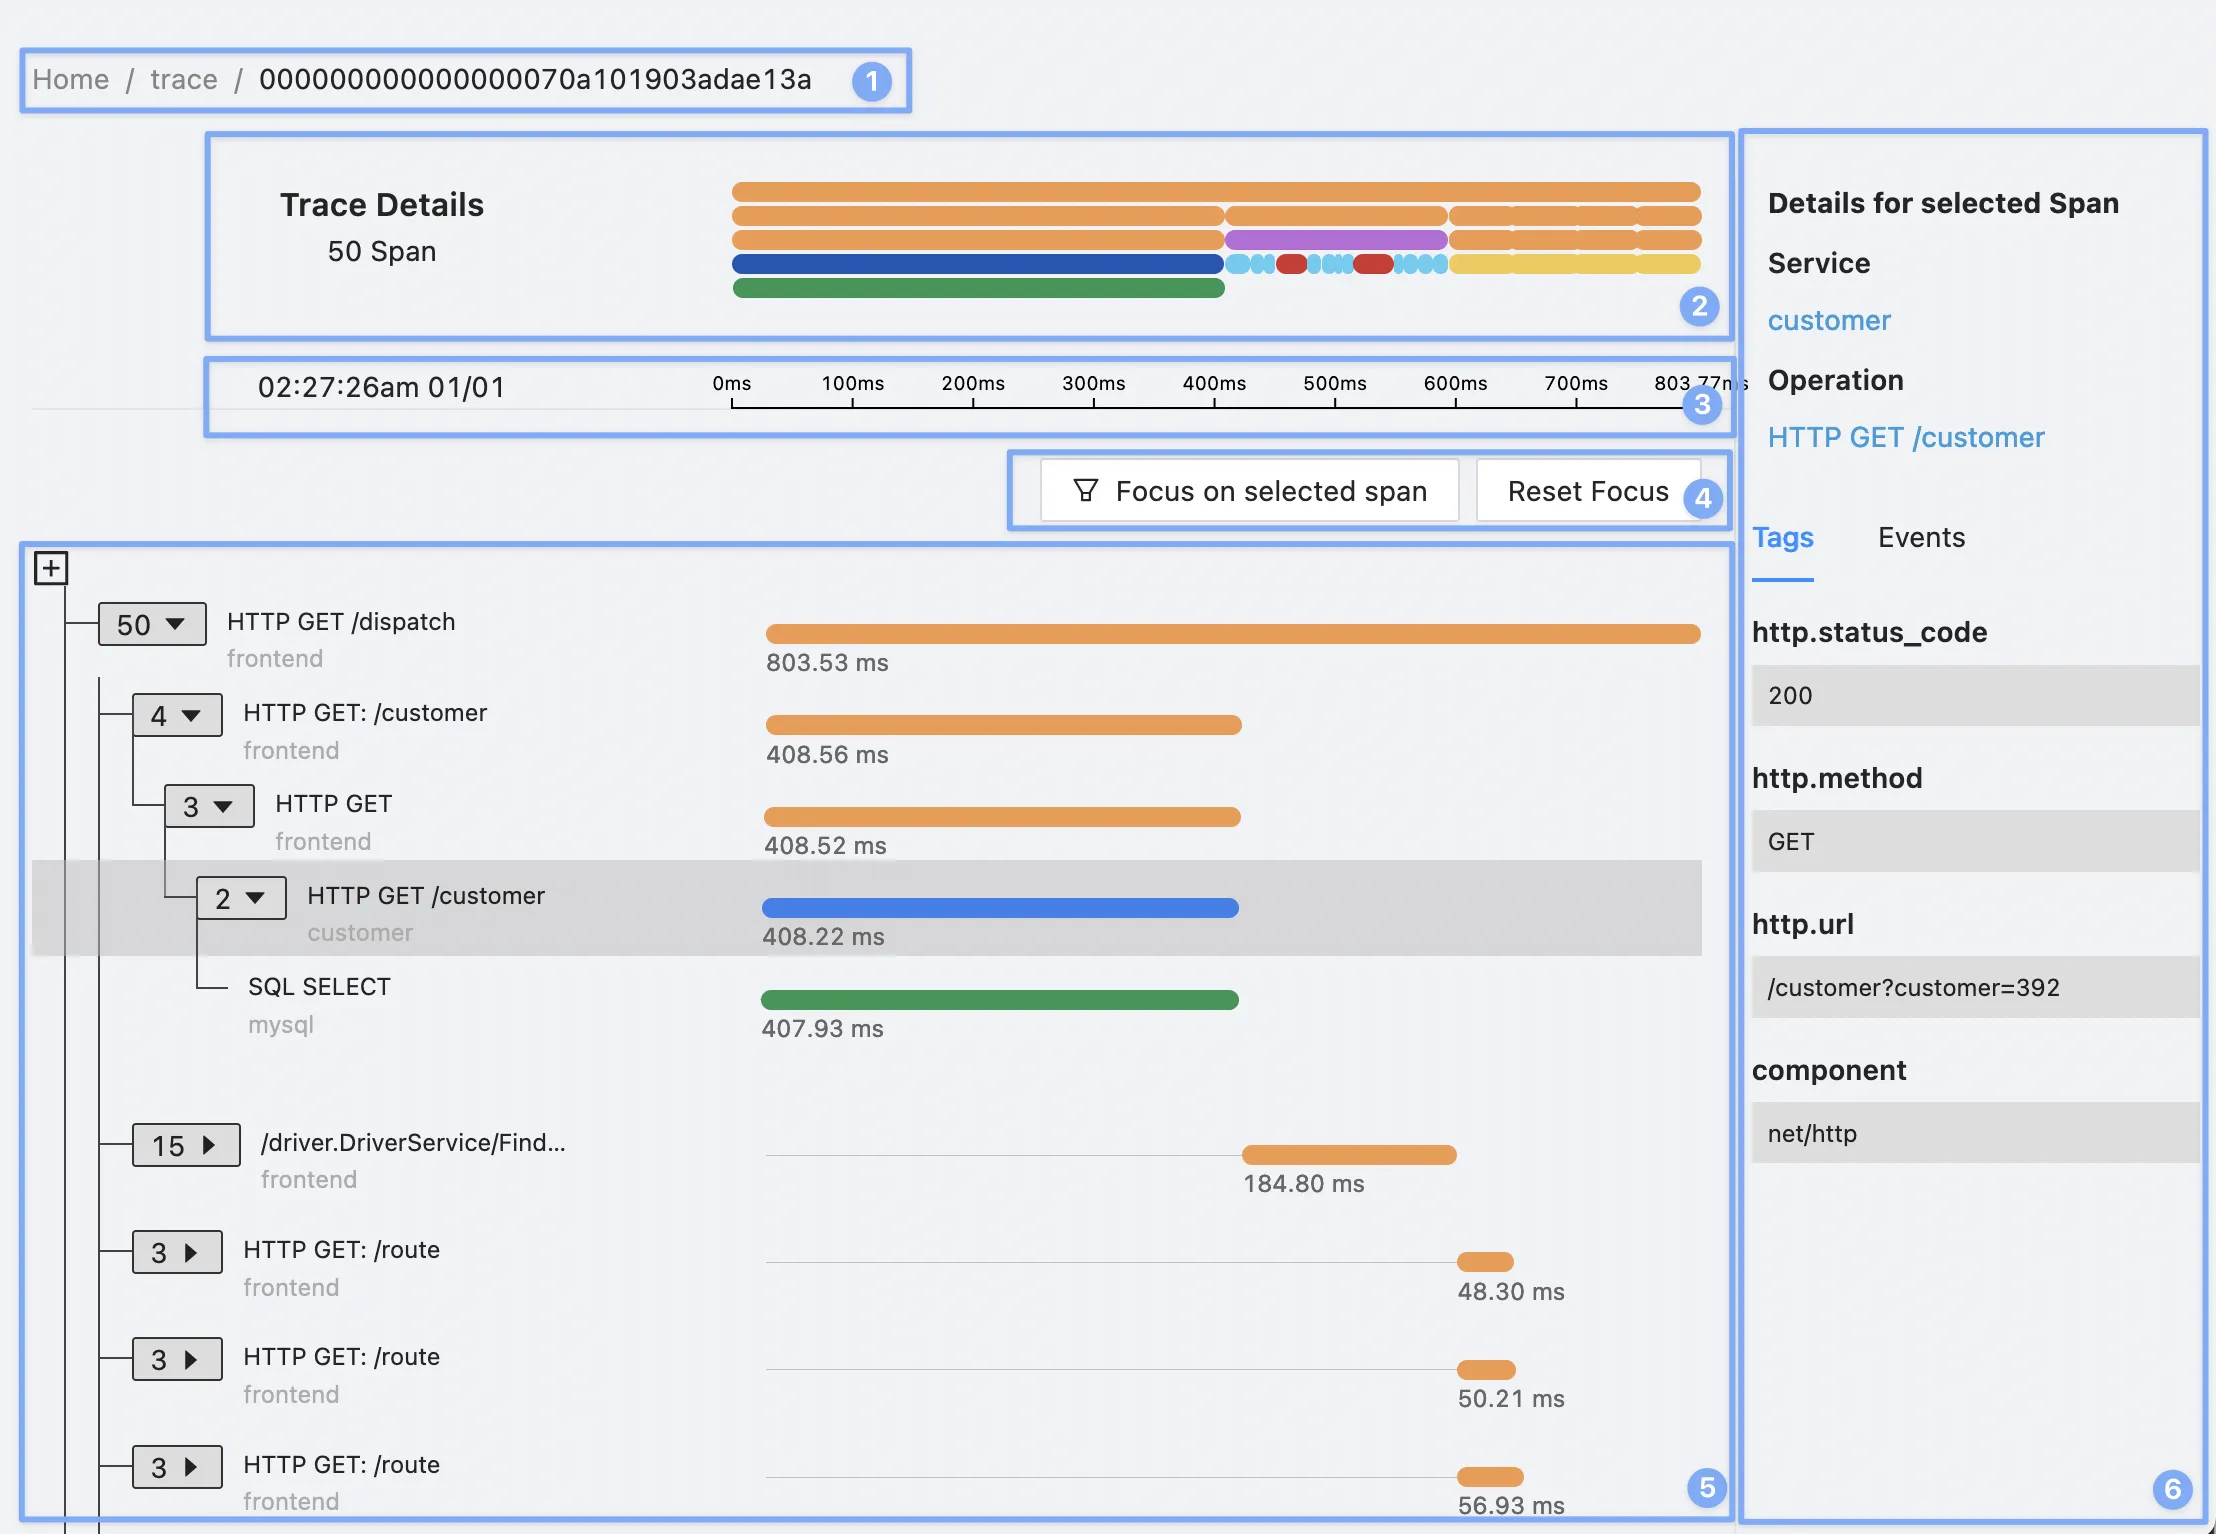
The following illustration shows the Span Details page:

Legend:
- Trace ID: At the top of the page, SigNoz displays the ID of the currently selected trace.
- Flame Graph: Shows the flame graph.
- Time: Displays the start time and duration of the currently selected trace.
- Focus: Allows you to focus on a specific span.
- Main content area: Displays all the spans as a tree structure. You can expand or collapse individual nodes in the tree to show or hide its children nodes. For each node, SigNoz displays the number of children nodes.
- Span Details: Displays the tags and events for the currently selected span.
View Details About a Span
To view details about a span, select it either in the flame graph or the main content area.
Focus on a Specific Span
Select the Focus on selected span button to view only the currently selected span. In the following example, you can see how to:
- Select a span
- Focus on that span
- View all the spans again
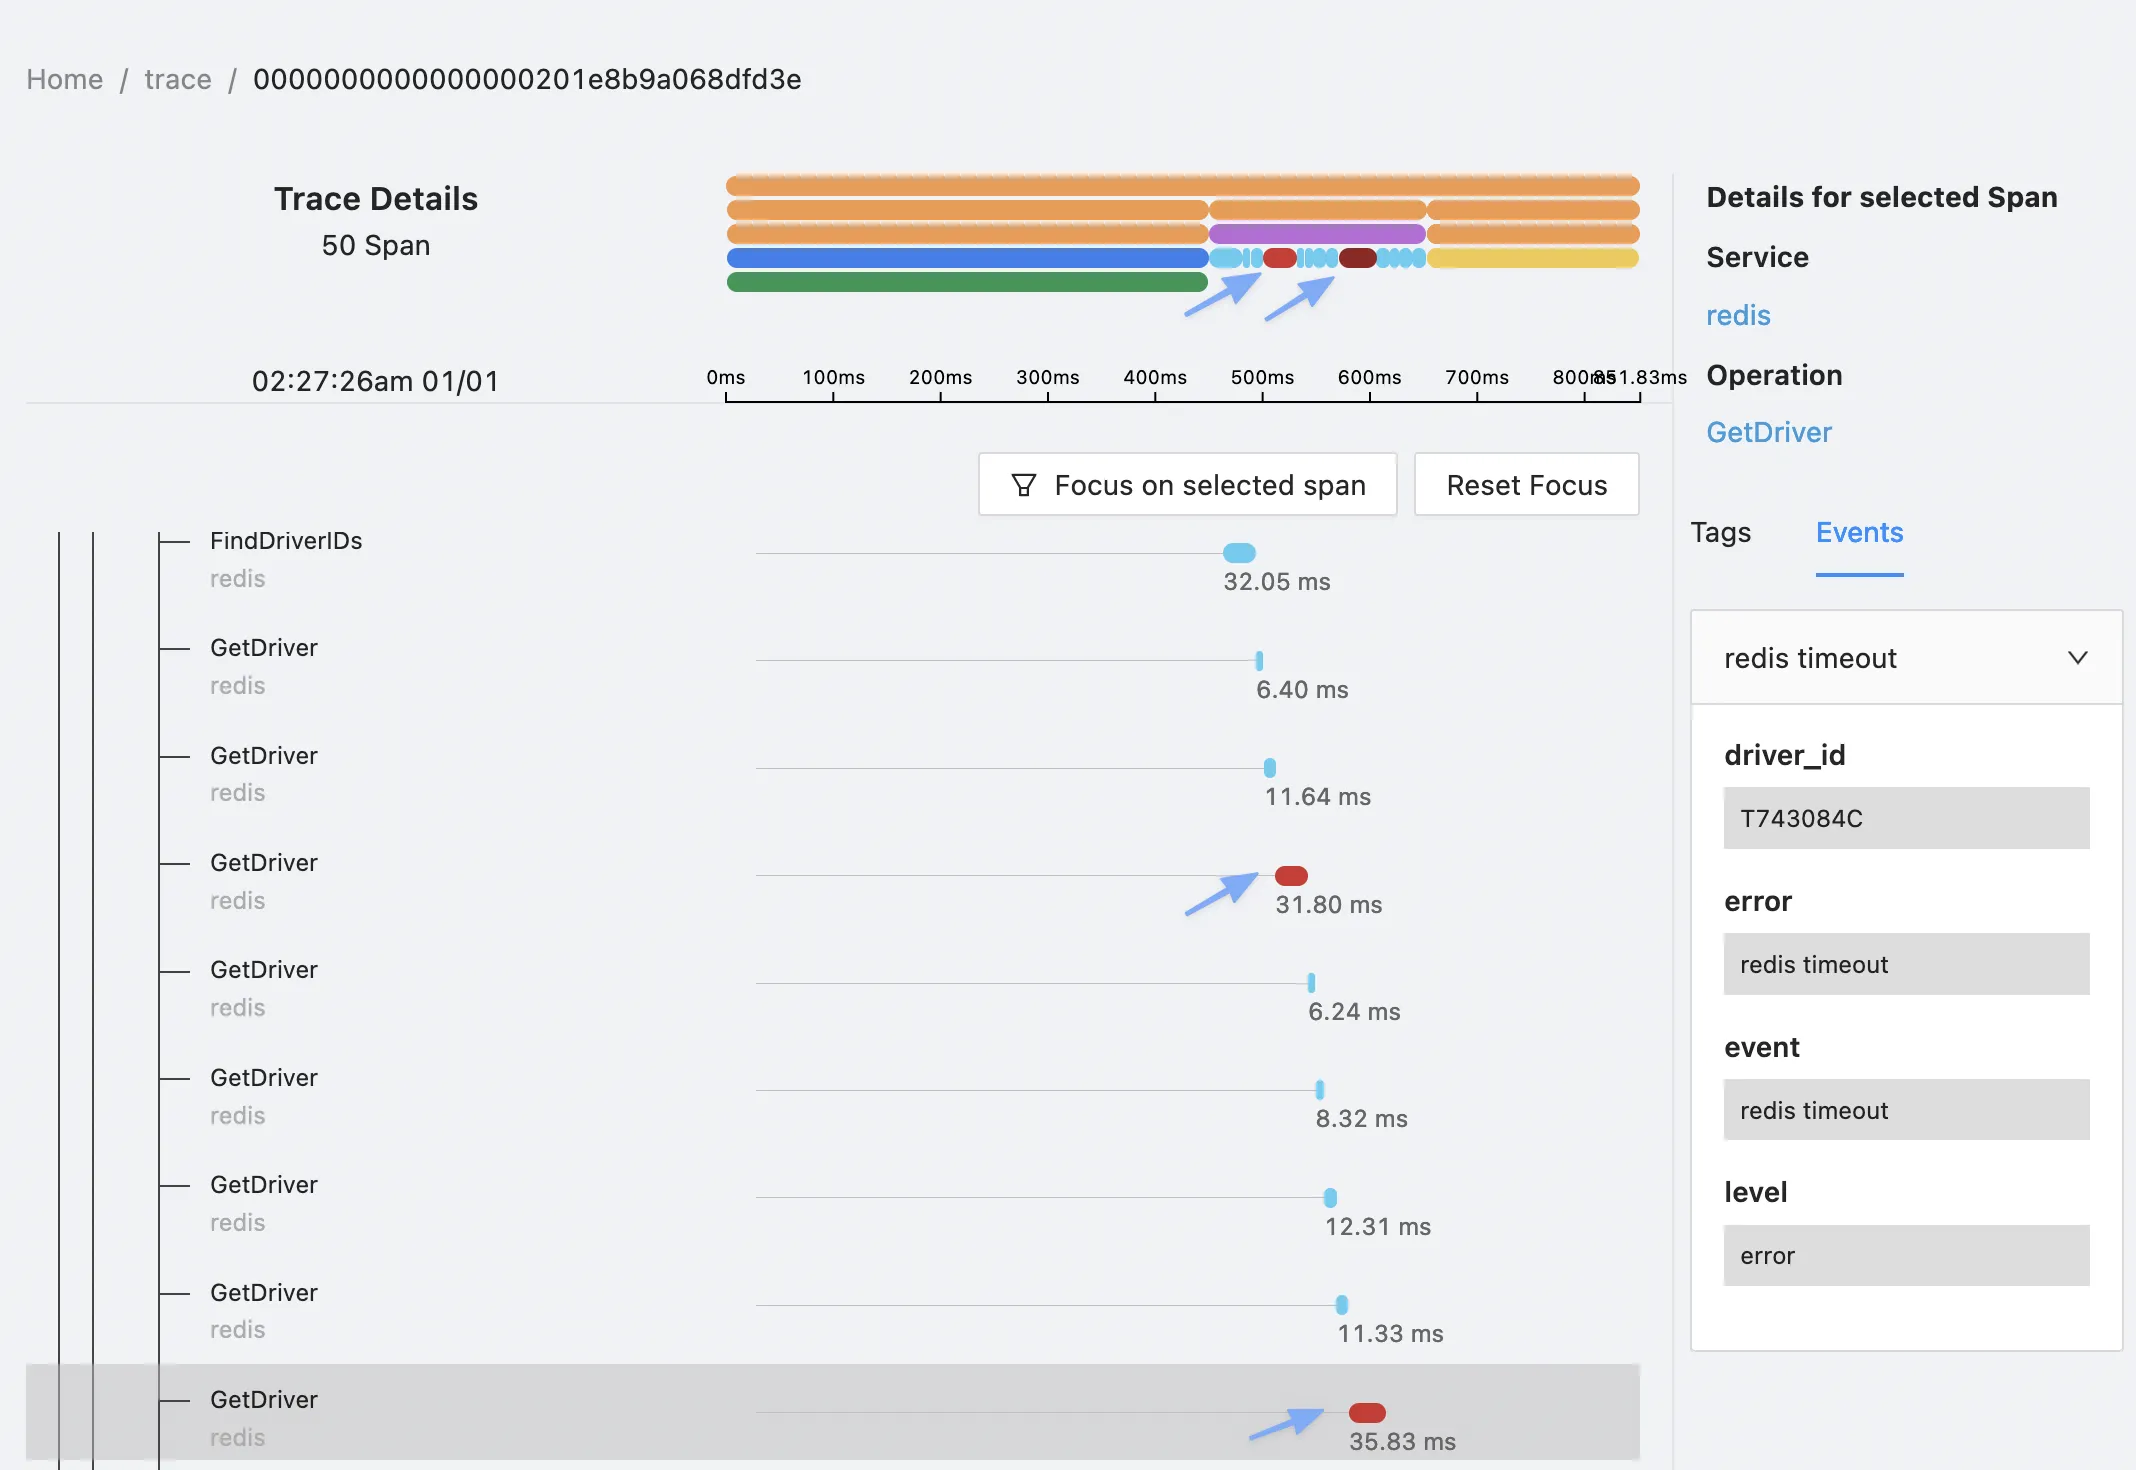
Identify Spans with Errors
On the Span Details page SigNoz highlights in red all spans with errors. In the following example screenshot, you can see two spans with errors:
