View Services
This page walks you through the Services section and gets you started with monitoring your application. You’ll learn the following:
- What are application metrics
- How to use the Services section to see an overview of your applications
- How to view details about a specific application
This section uses the HotR.O.D sample application that comes preinstalled with SigNoz and generates sample data that you can query. You can apply the concepts and techniques you’ll learn to monitor your own applications.
Prerequisites
This section assumes that your application is already instrumented. For details about how you can instrument your application, see the Instrument Your Application section.
What Are Application Metrics?
Application metrics represent a characteristic of your application as a value at a specific point in time. For example, an application metric is the number of requests per second your application serves. SigNoz collects information as a sequence of data points every minute and then represents the data through time in a graphical form. The X-axis is time, and the Y-axis is the value.
The Services section relies on the rate, errors, and duration (”RED”) method to help you predict the experience of your users and includes the following keys metrics:
- P99 Latency: the amount of time your application spends processing each of the fastest 99% of requests. For example, if the value of the
P99latency is 760 ms, 99% percent of requests have responses that are equal to or faster than 760 ms. - Error Rate: the percentage of failing requests i.e ratio of error requests to the total requests.
- Requests per Second: the number of requests your application processes per second.
- Key Operations: It lists the key APIs and operations which the particular application is serving.
- Apdex: It is a score between 0 and 1 that helps you measure the user satisfaction.
Open the Services Section
From the sidebar, select Services:
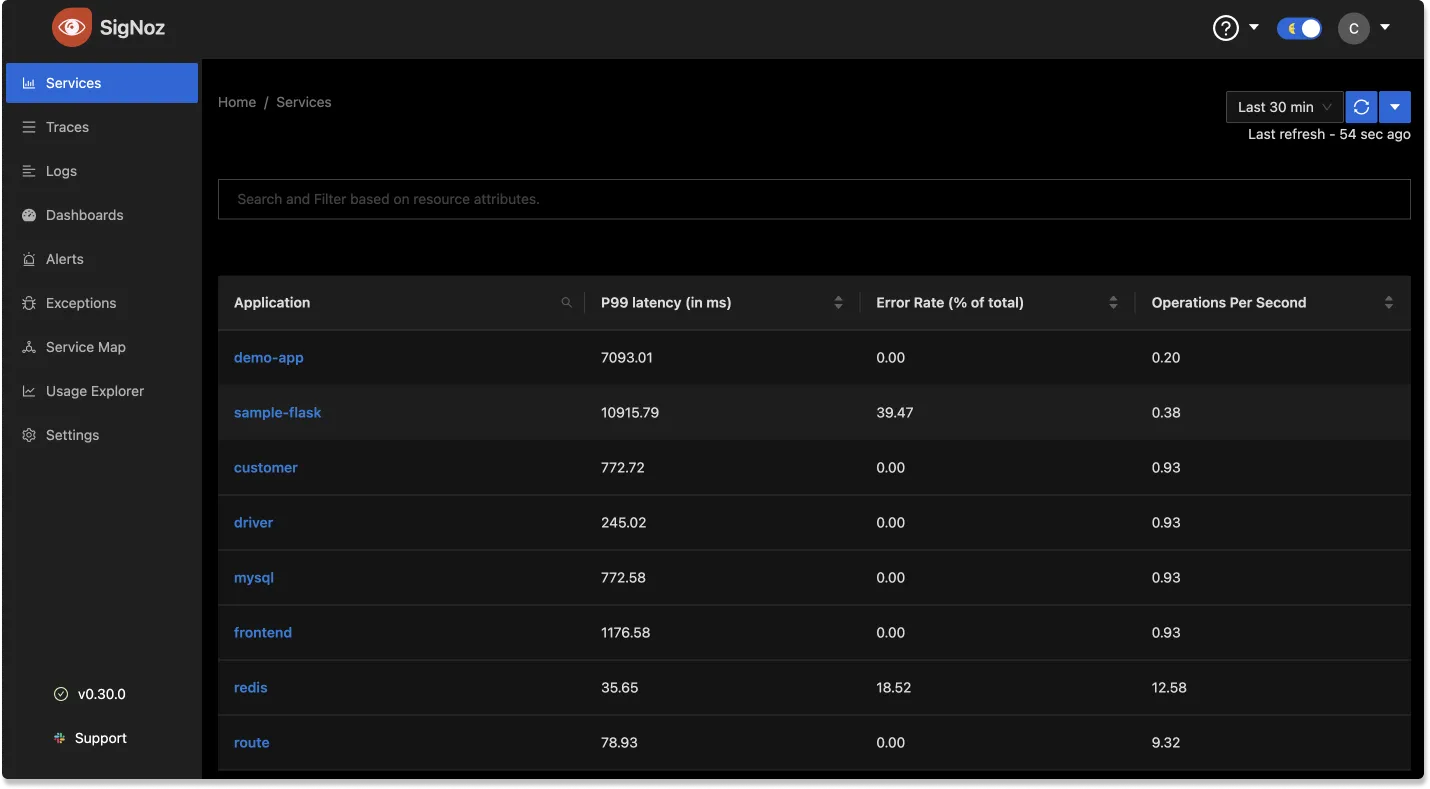
This page provides an overview of your applications’ health and performance. It shows the list of your applications formatted as a table and, for each application, SigNoz displays the RED metrics mentioned above.
This page shows all the instrumented applications sending the data to SigNoz. This includes web servers, message brokers/queuing systems, web/mobile clients, cron jobs, and more.
What services are shown? And how are the RED metrics calculated?
We rely on the semantic conventions provided by OpenTelemetry. Every unique service.name configured and received is part of the service list.

The following logic is used for the RED metrics generation of each service. In a distributed trace, a request goes through several entities performing various kinds of work. There is an entry point span for each service that took part in the trace journey. This can be thought of as a sub-root span for the service. This sub-root span can have many child spans which could be doing work in parallel or sequential or a combination of both. From an outside perspective this sub-root span work is an operation done by the service and how much time it took to complete this operation is the duration metric. For a web server, this is an API endpoint returning some data and request time is the duration metric. For a messaging consumer service, this is a consume trigger, and till it is done with the message received. For a mobile client application, this could be a button click to submit a form and the time taken to fulfill the request.
- Operations/s - Number of sub-root spans seen for a service
- PXX - Quantile of the duration of the sub-root spans
- Error rate - Number of sub-root spans with status error / Total number of sub-root spans
Sort the List of Applications
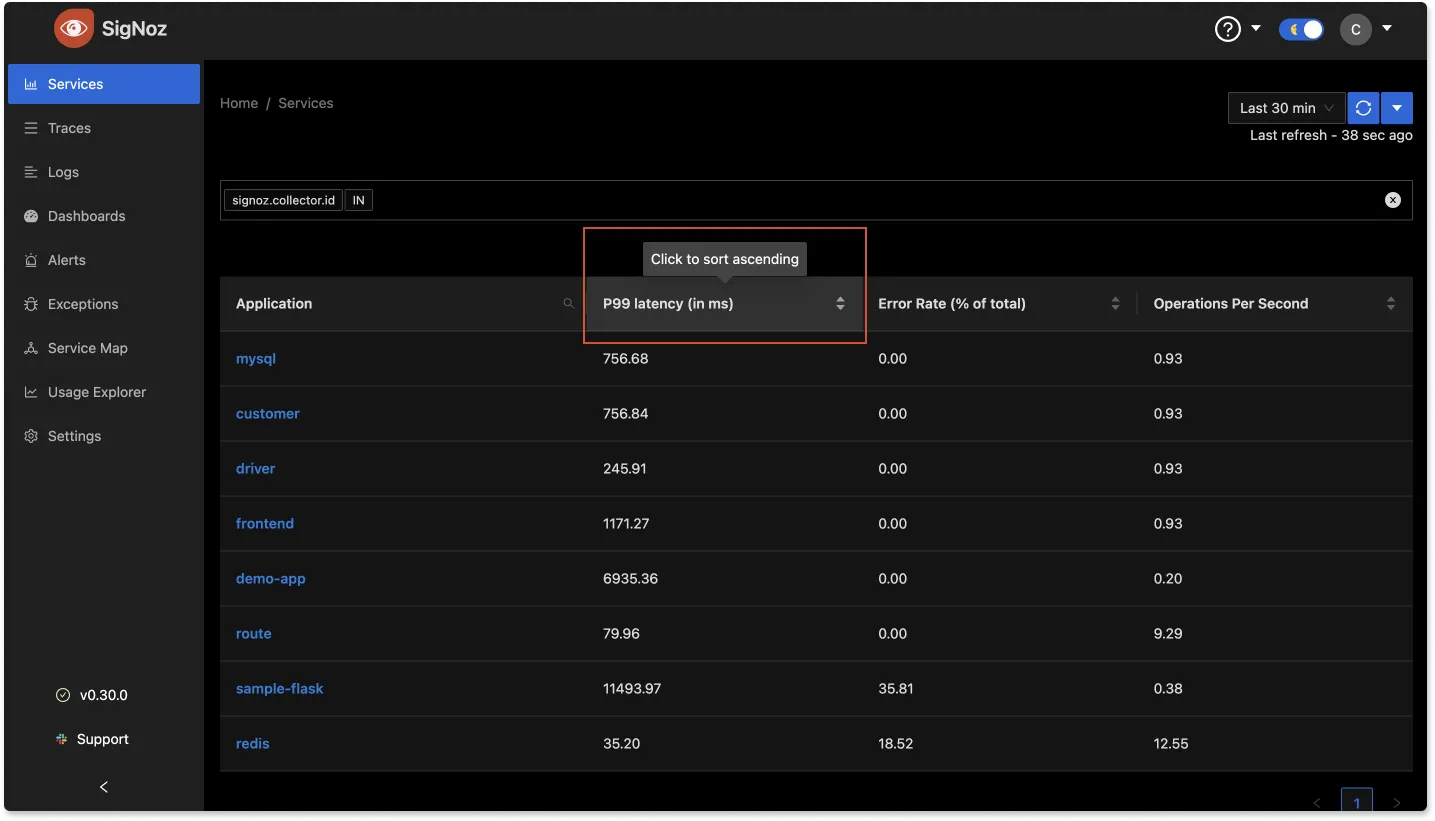
You can switch the sorting order of the values in a column by clicking its heading: first click for ascending order, second click for descending order, and a third click to cancel the sorting.
Filter the List of Applications
You can add attributes to applications and filter based on these attributes.
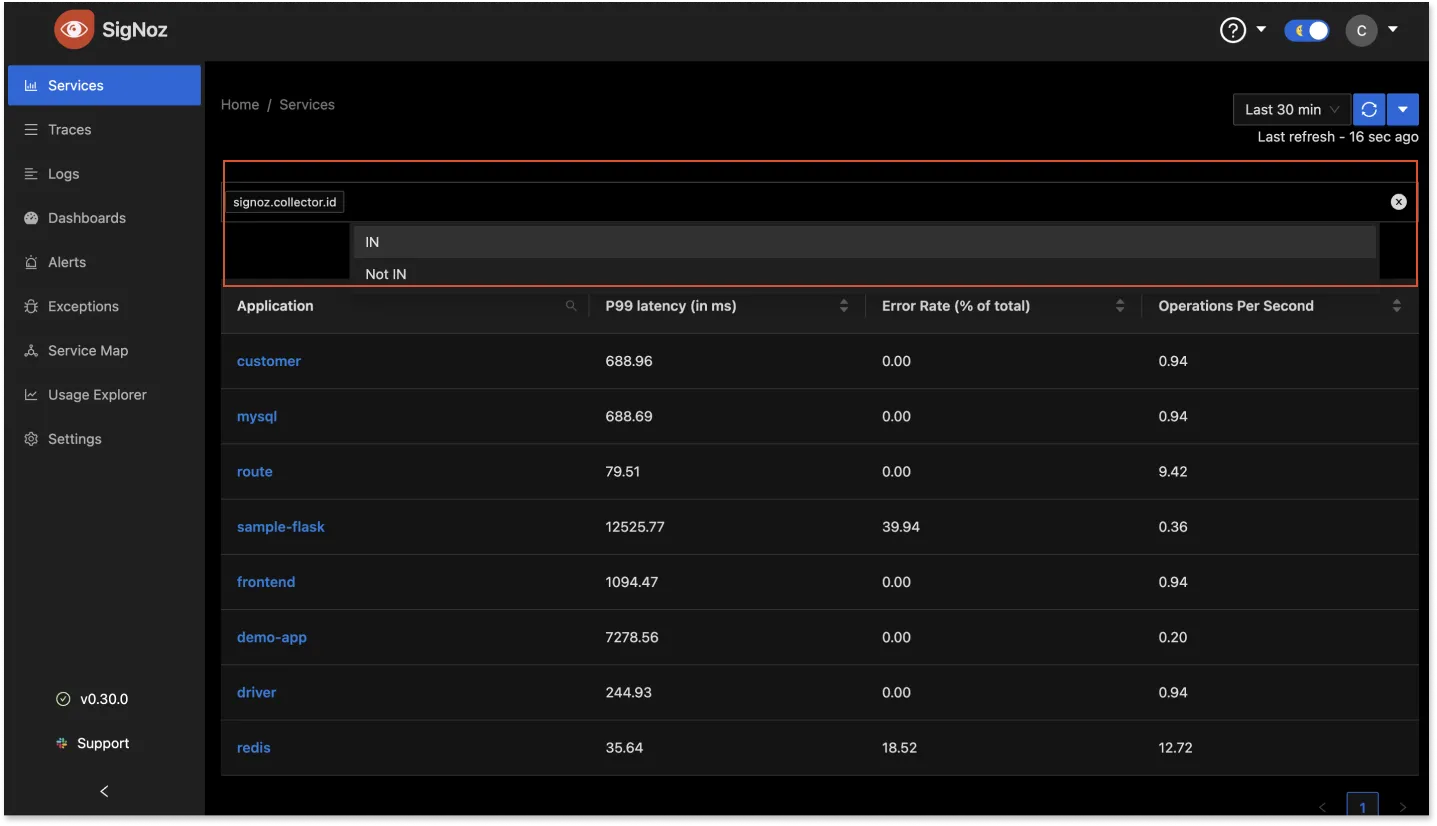
You can add attributes with OTEL_RESOURCE_ATTRIBUTES flag when starting the application. The below example shows how to set values for service.namespace and deployment.environment
OTEL_RESOURCE_ATTRIBUTES="service.name=flaskApp,service.namespace=sampleapps,deployment.environment=play" OTEL_EXPORTER_OTLP_ENDPOINT="http://3.11.144.34:4317"
OTEL_EXPORTER_OTLP_PROTOCOL=grpc opentelemetry-instrument python3 app.py
By default, you can filter based on service.namespace and deployment.environment dimensions.
To add another dimension, update the dimension fields of config.yaml file and then deploy the yaml file again.
Global Time
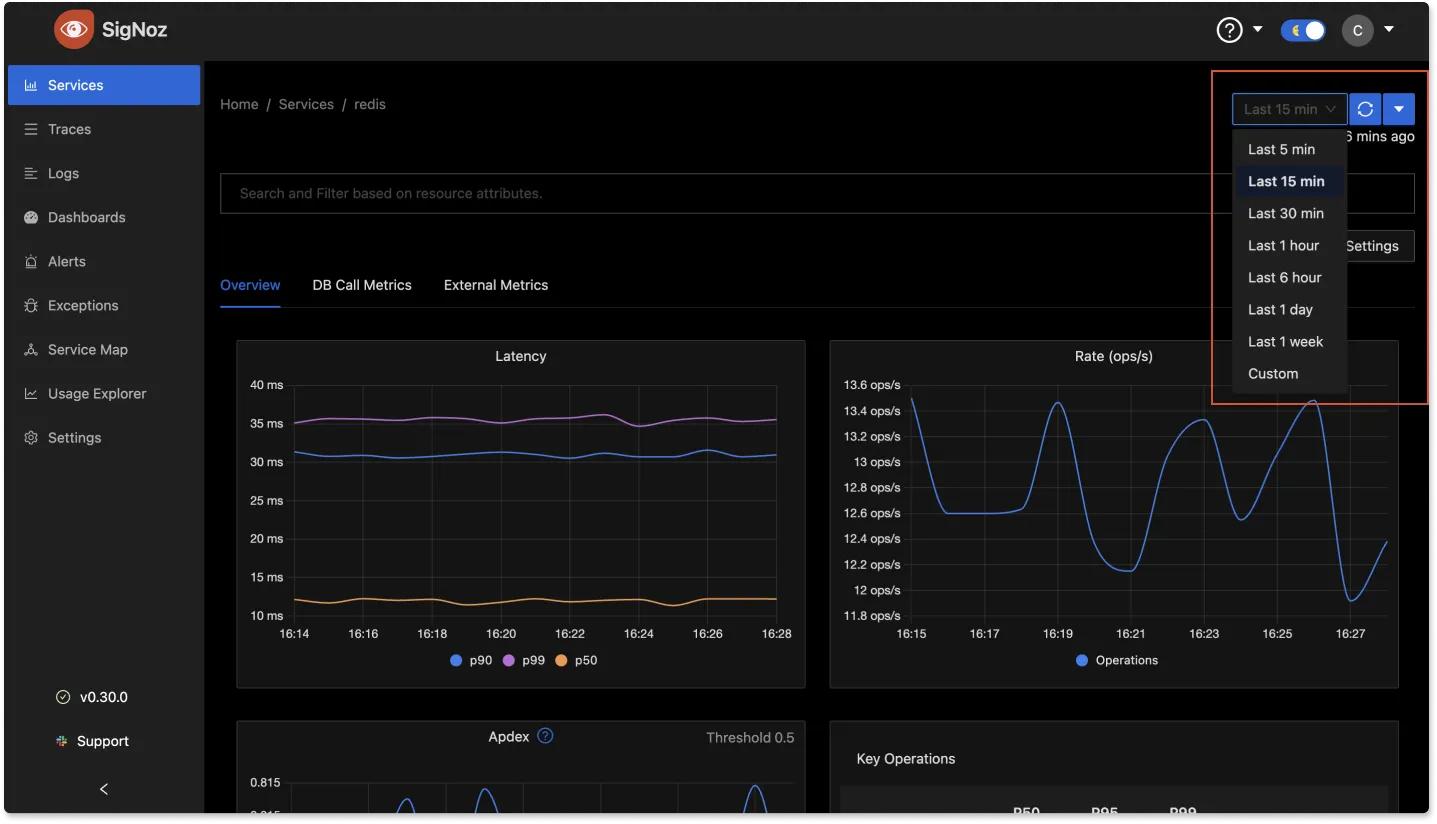
On the top right corner of your application's dashboard, you have the ability to select the time frame for the data displayed in all the metric graphs. You can choose from a range of options, spanning from the last 5 minutes to the past week, and even opt for a custom date range.
View Magnified graphs
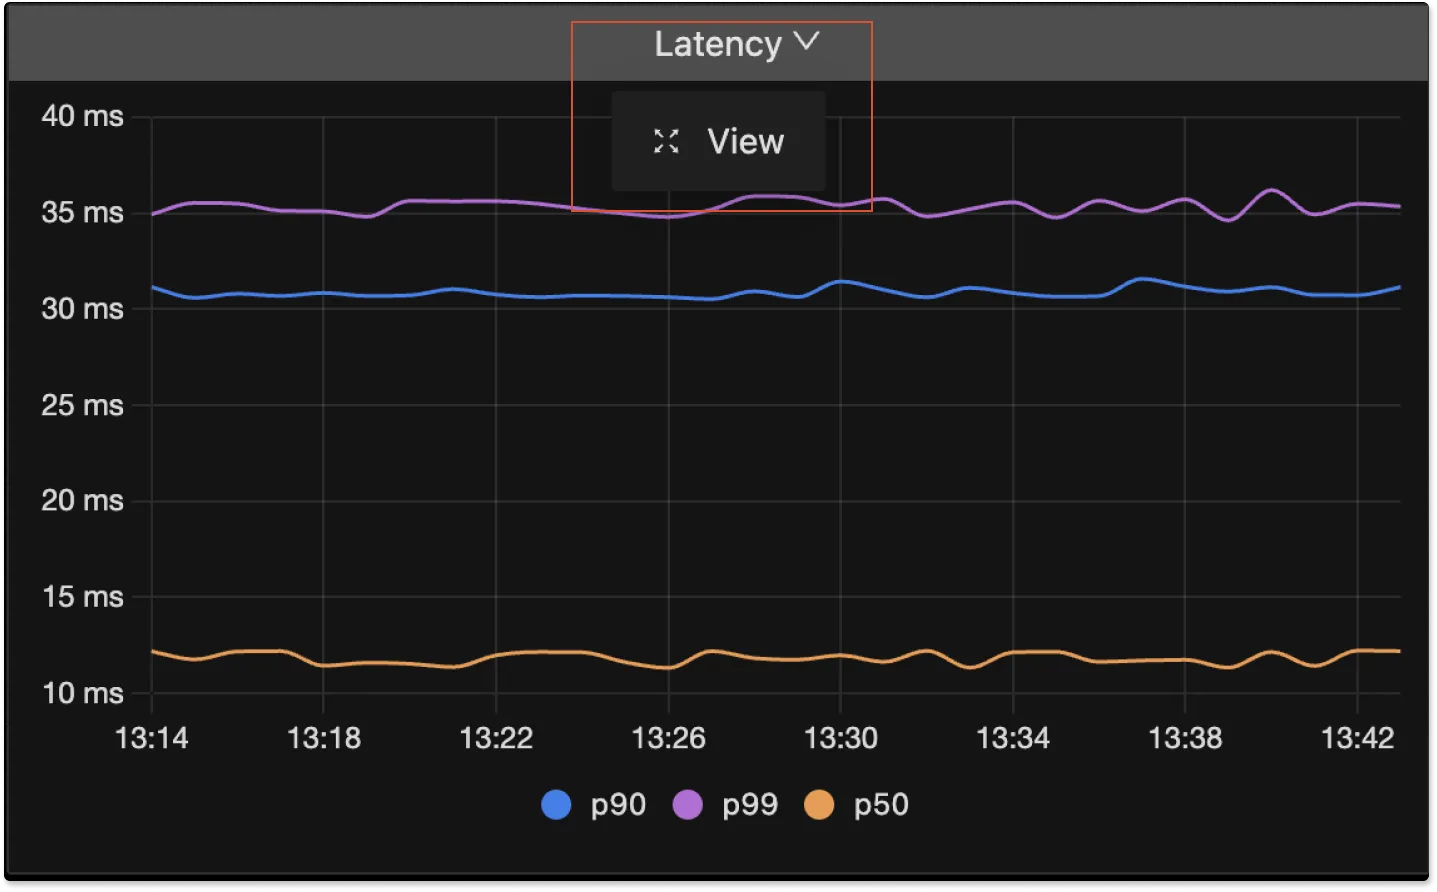
You can magnify the graphs by hovering over the Metric name, clicking the dropdown arrow, and selecting the "View" option.
Filter Series
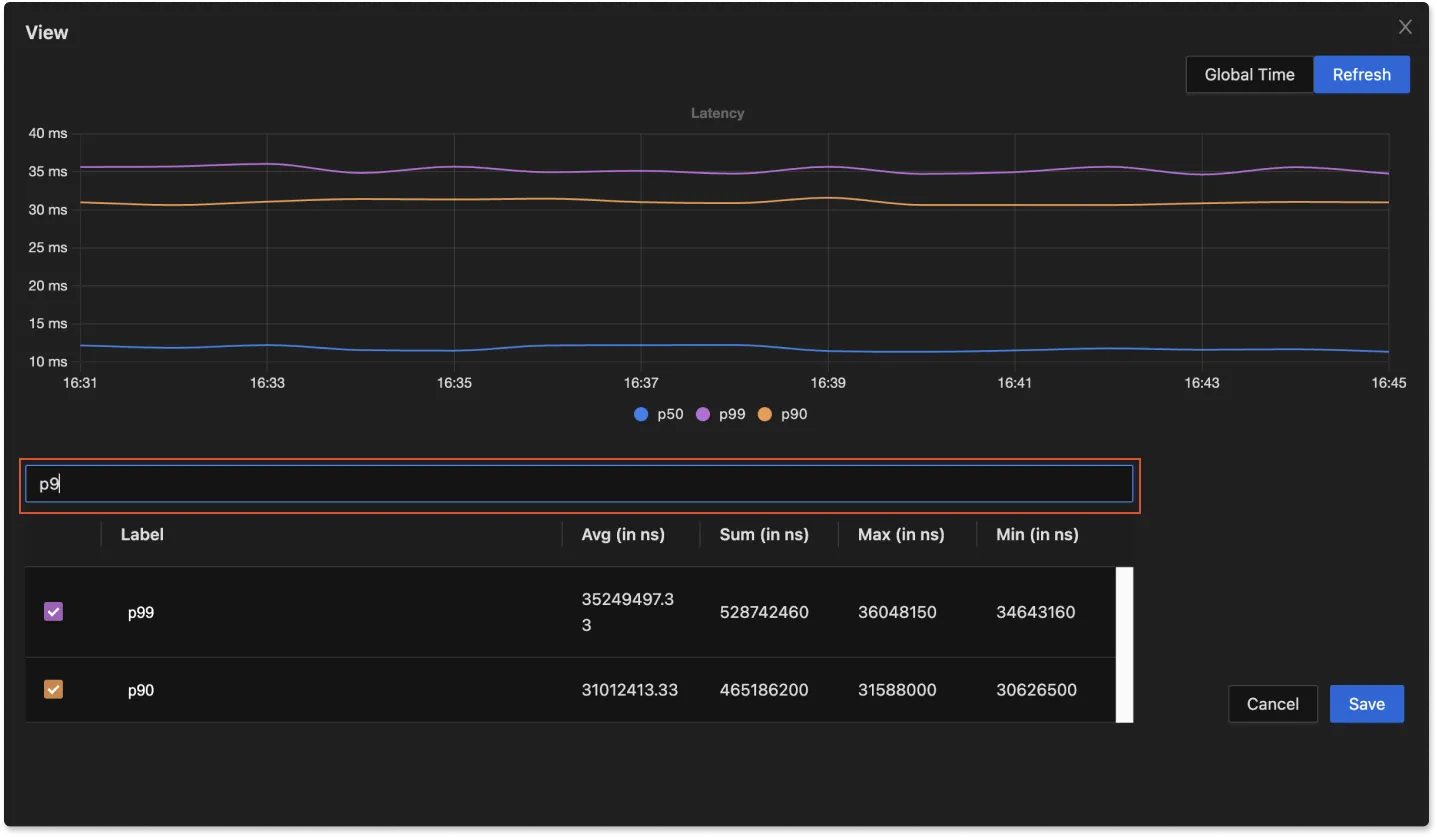
Inside the Metric's graph, you can use the "Filter Series" search bar to locate specific labels, allowing you to include or exclude them from the graph. For instance, in the image below, our search for 'p9' within the latency graph resulted in the display of 'p90' and 'p99' latency data. Click on the Save Button to save any changes.
View Details About an Application
The RED metrics help you spot performance bottlenecks or failures across all your applications. For example, if the error rate of an application increases, you can assume that these errors will impact the experience of your customers. Once you’ve identified a potential issue, select a row to open the application details page:
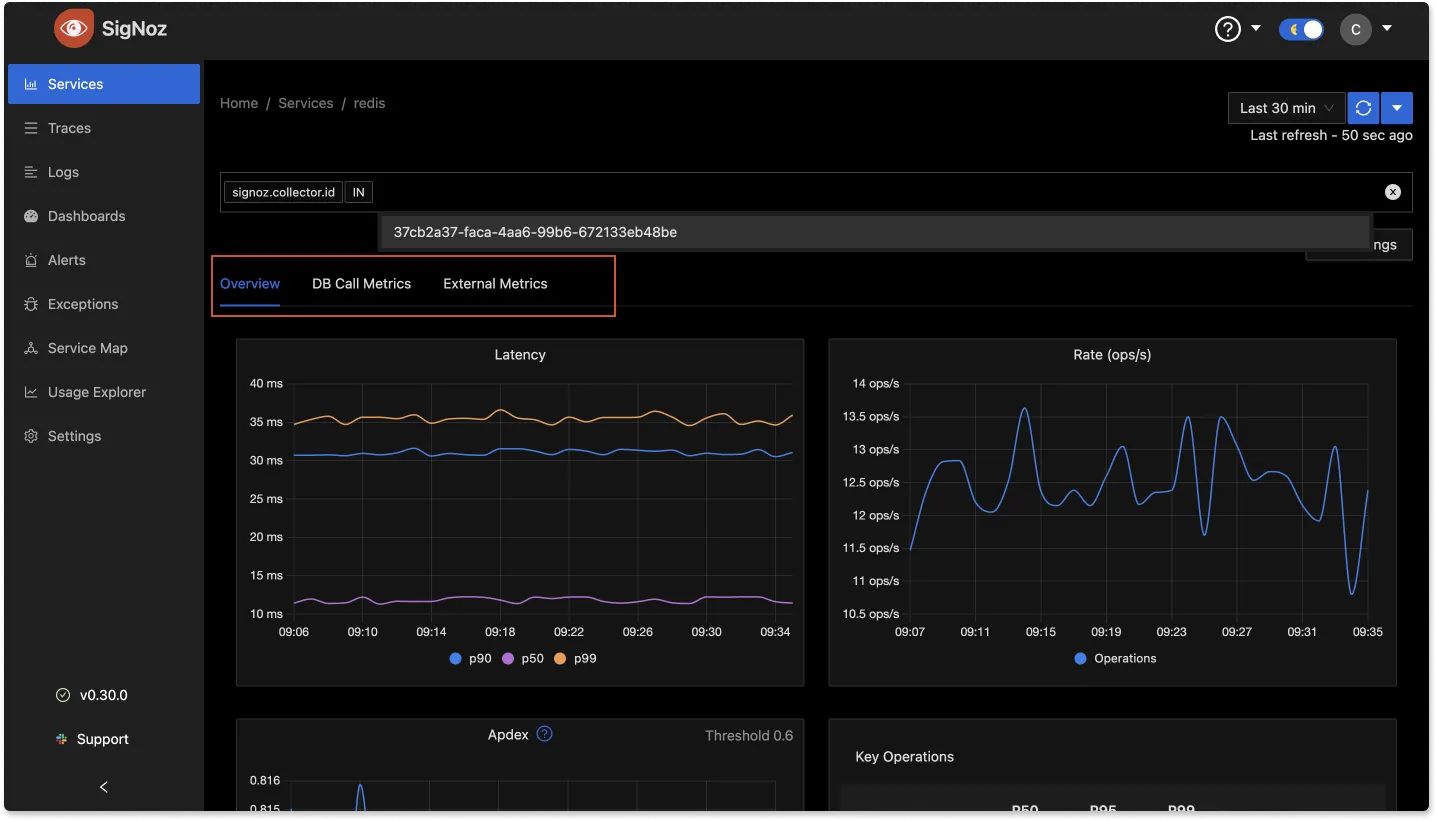
The application details pane contains three panes:
- Application Metrics - Overview
- Database Calls
- External Calls
Application Metrics in SigNoz
The application metrics pane is comprised of five graphs:
Application Latency in Milliseconds
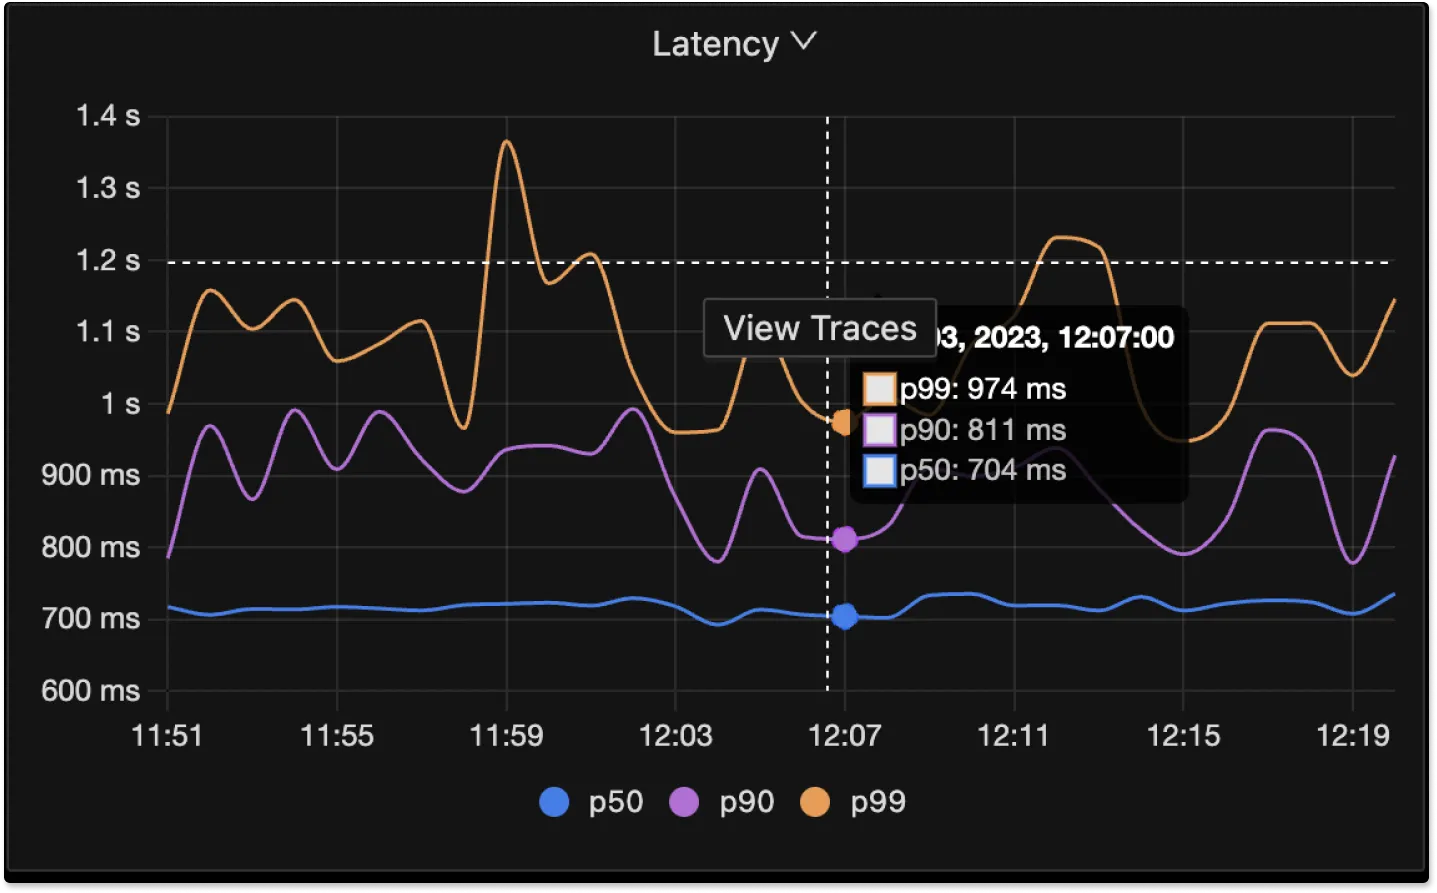
This graph shows the P99, P95, and P50 latencies for the selected period of time.
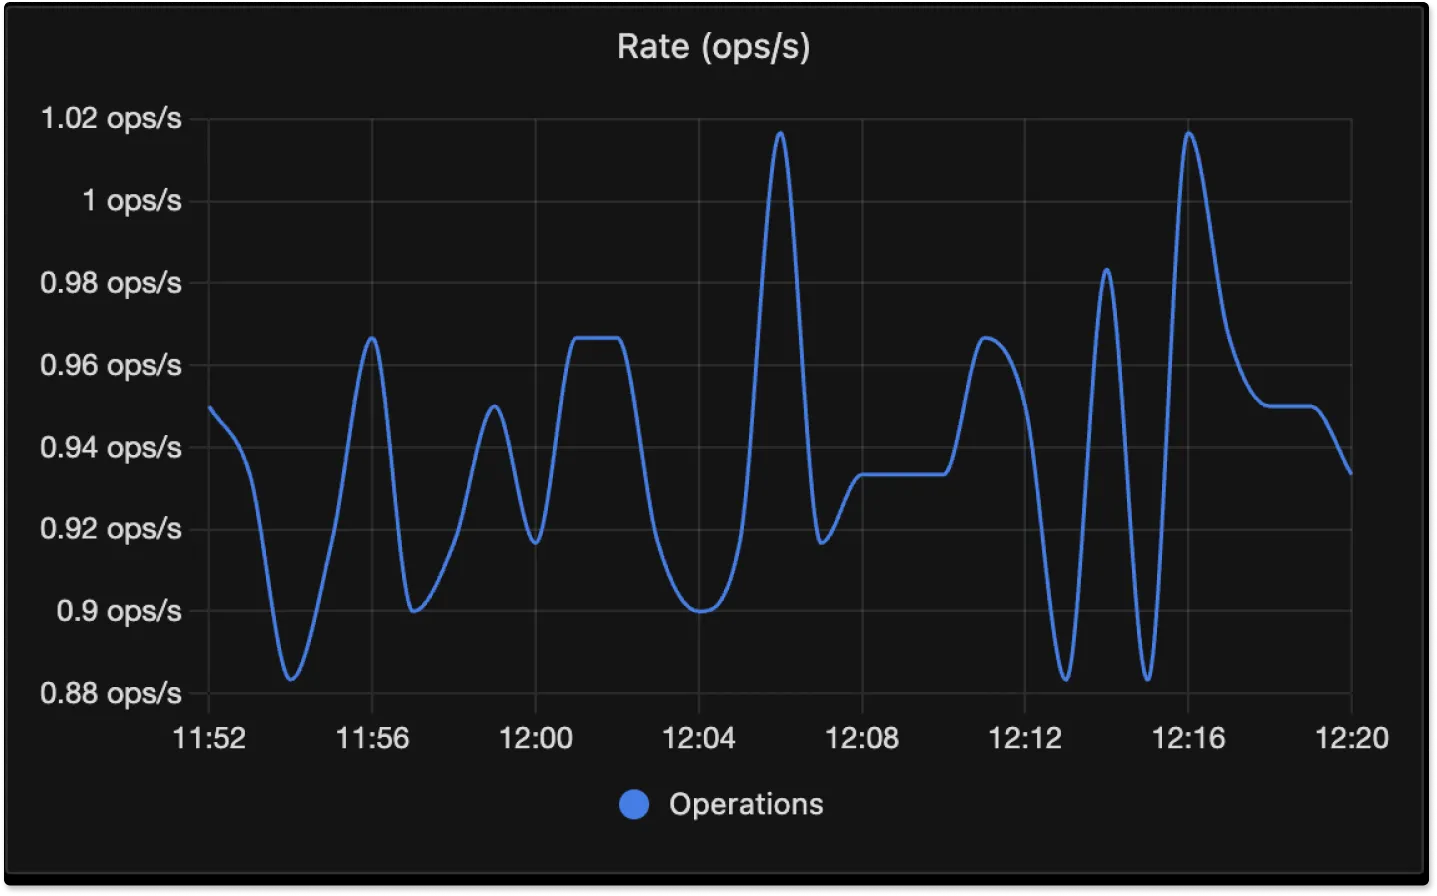
Operations per Second
This graph shows the number of operations (Example requests) per second your application currently serves.
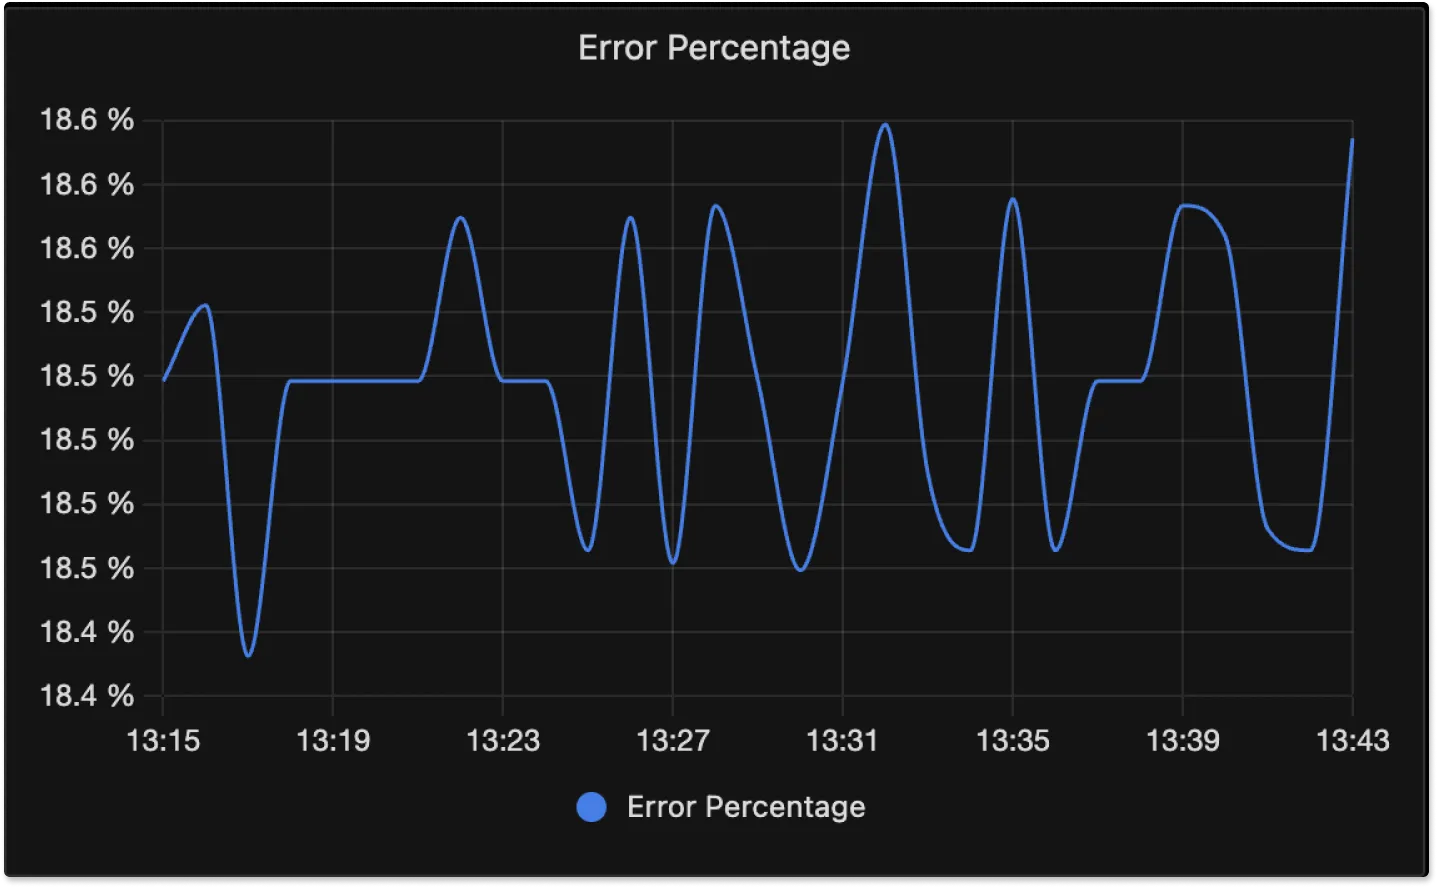
Error Percentage
This graph shows the percentage of errors of the total sum of requests.
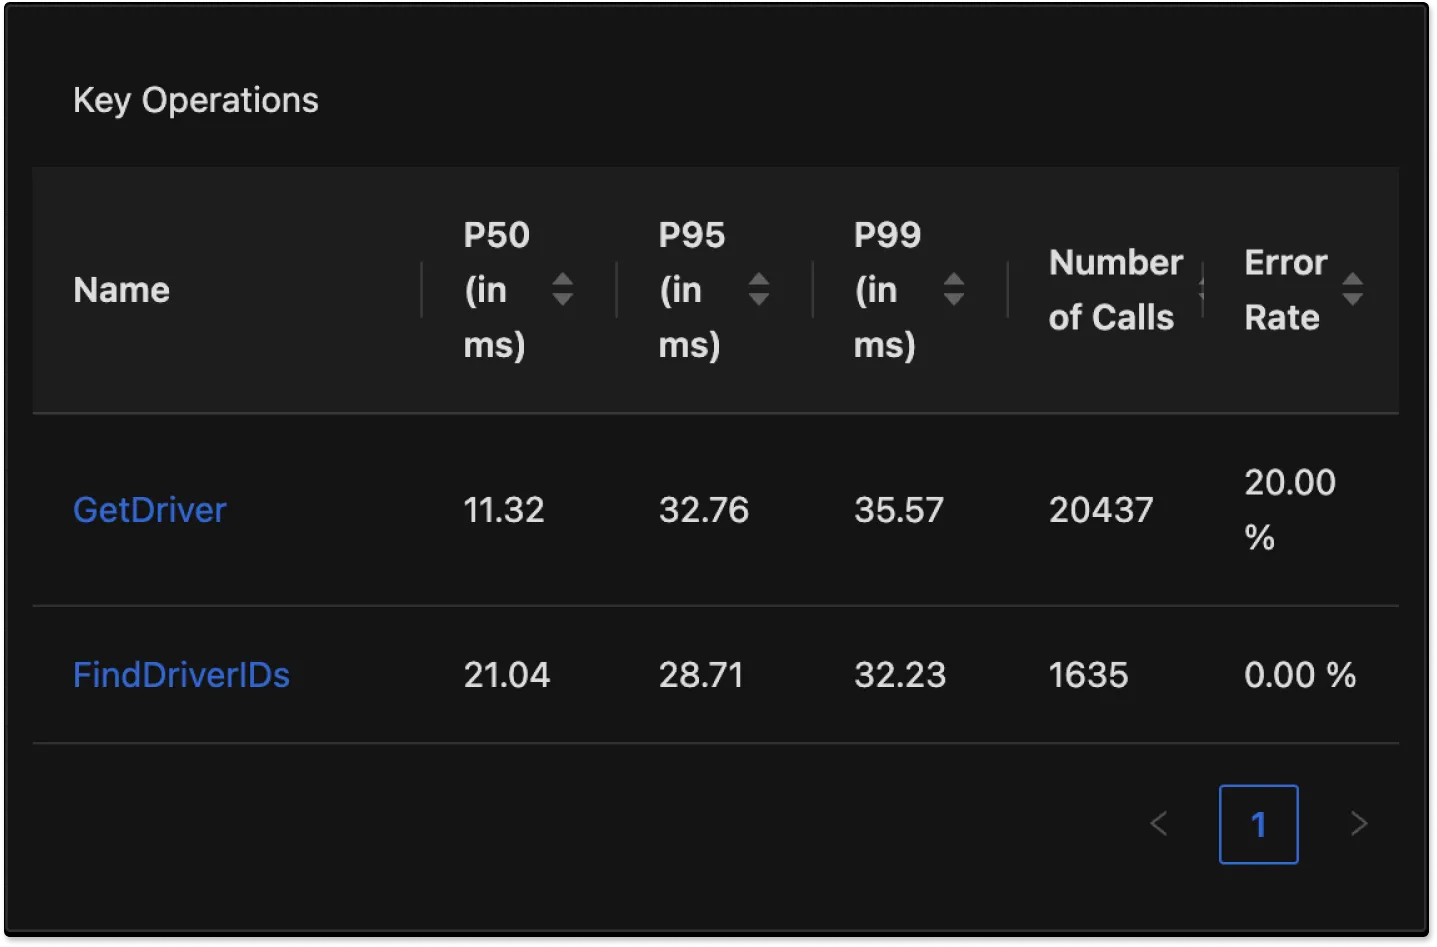
Key Operations
This list helps you find the slow operations of your application. You can select a column heading to sort the list by the values in that column. Select the column heading again to reverse the sort order or to cancel sorting.
Apdex
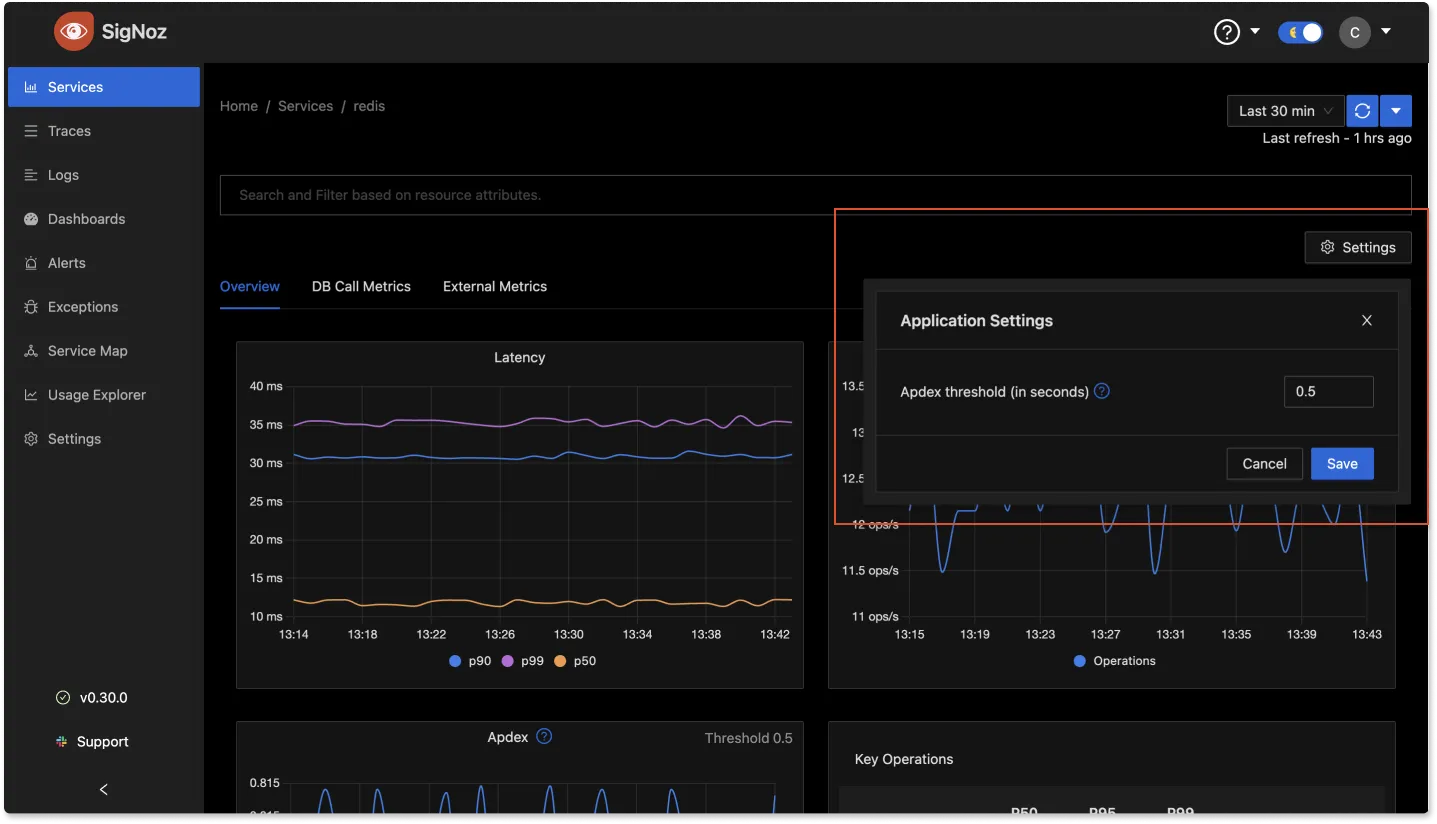
Application Performance Index (Apdex) is an open standard that defines a method to report, benchmark, and rate application response time. An Apdex score helps you understand and identify the impact on application performance over time.
The Apdex score indicates the end users' level of satisfaction from 0 (least satisfied) to 1 (most satisfied). Threshold is an aribtary value which is set to 0.5 by default and can be changed according to the requirements.
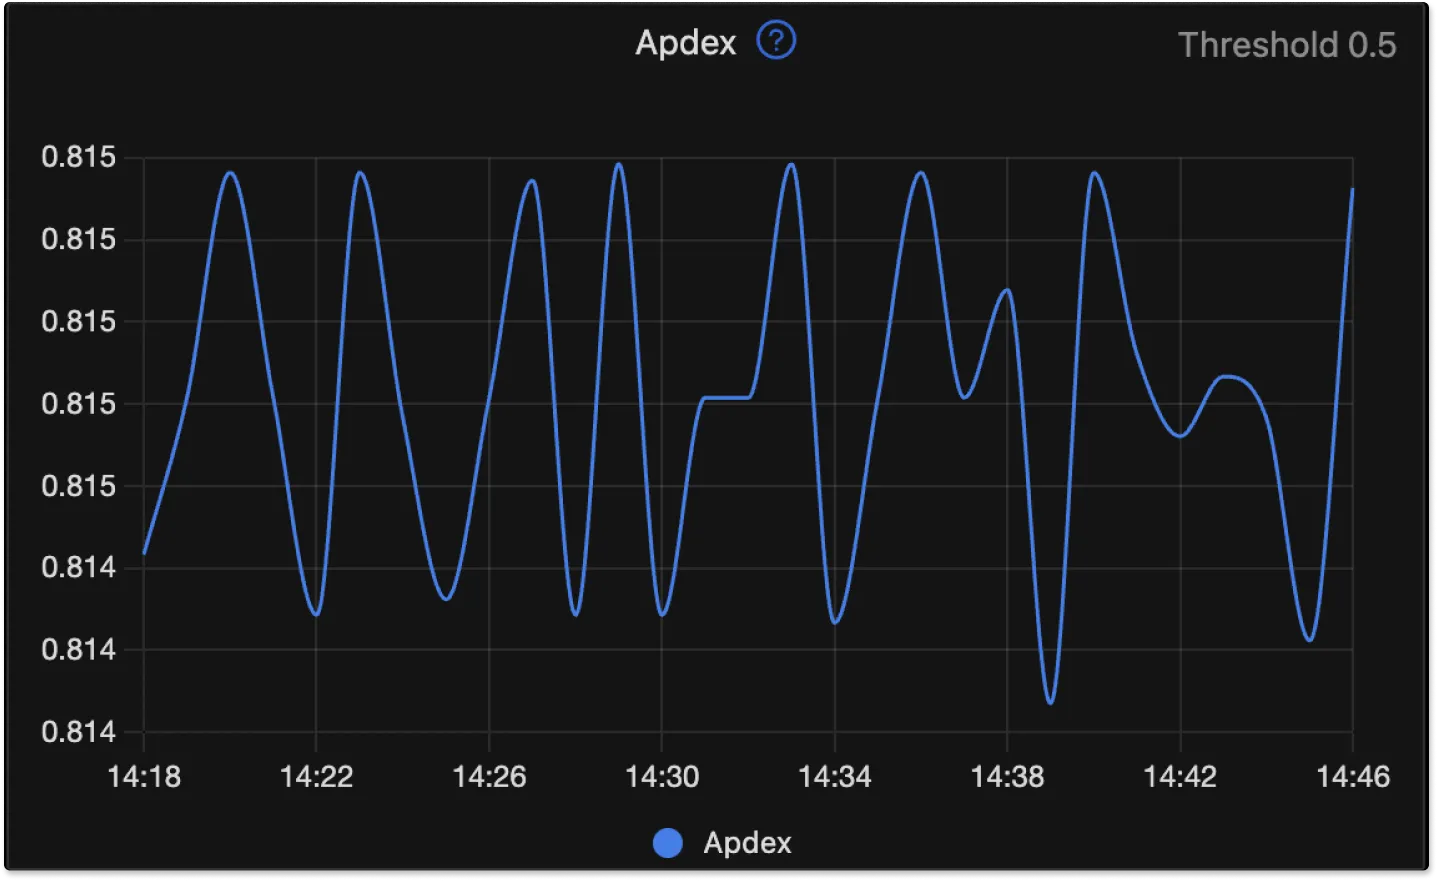
You can change the Threshold value by going to Settings on top-right corner of your SigNoz dashboard.
Database Calls in SigNoz
This pane shows details about the database calls that your application makes. The spans should have the following span attributes to be counted in this panel
span.kind!=2which means these are spans of kind anything exceptSERVER. You can read more details on SpanKinds heredb.systemshould be present as span attribute
If your services are making DB calls and your Database Call panels show as empty, please make sure that:
- Your spans have the above attributes.
- You have used appropriate libraries for instrumenting packages which you use to make DB calls from your application
The graphs in this pane provide the following information:
- The number of database calls per second
- The average duration of your database calls. expressed in milliseconds
External Calls in SigNoz
The external calls pane allows you to track the external services your applications depend on.
The spans should have the following span attributes to be counted in this panel
span.kind=3which means these are spans of kindCLIENT. You can read more details on SpanKinds here- One of the following sets of attributes
- rpc.system, rpc.service, rpc.method
- rpc.system, net.peer.name, net.peer.port
- rpc.system, net.peer.ip, net.peer.port
- http.host
- net.peer.name, net.peer.port
- net.peer.ip, net.peer.port
- http.url
- peer.service
The remote host address is constructed from one of the attribute sets in the order listed above. This includes any database calls that have transport other than unix domain socket or pipe, or a call to another http host, or an aws lambda function and generally any out of process call over the network.
If your services are making external calls but External Call panels show as empty, please make sure that your spans have the above attributes.
The graphs in this pane provide the following information:
- The percentage of external calls that resulted in errors.
- The average duration of all your external calls.
- The number of external calls per second by address.
- The average duration of your external calls by address.
Get Help
If you need help with the steps in this topic, please reach out to us on SigNoz Community Slack.
If you are a SigNoz Cloud user, please use in product chat support located at the bottom right corner of your SigNoz instance or contact us at cloud-support@signoz.io.