Fields in Logs
A log line contains different attributes attached to it. These attributes helps you to filter your logs so that you can write effiecient queries and get your results faster. These attributes are reffered to as fields in SigNoz.
There are two kind of fields interesting and selected .
Interesting Log Fields
These kind of fields are the resource and log attributes which are parsed by the otel collector but is not indexed. These fields are also not auto suggested by the query builder. But you can still use these fields for querying by writing the query manually.
Selected Log Fields
These are created by converting an interesting field. When a interesting field is converted to selected field, an index is added to the field so that queries for this fields are faster. In addition to that when you write a query this fields will be autosuggested. Selected fields are also displyed explicitly with each log line.
Configuring the SigNoz Collector
If you take a look in the SigNoz repository, you’ll find the configuration for the collector in /deploy/docker/clickhouse-setup/otel-collector-config.yaml You can edit this file to filter what logs are being stored after being received by the collector.
After editing this file, you’ll need to restart the collector. If using Docker, the command would be docker restart signoz-otel-collector
Adding Atttributes
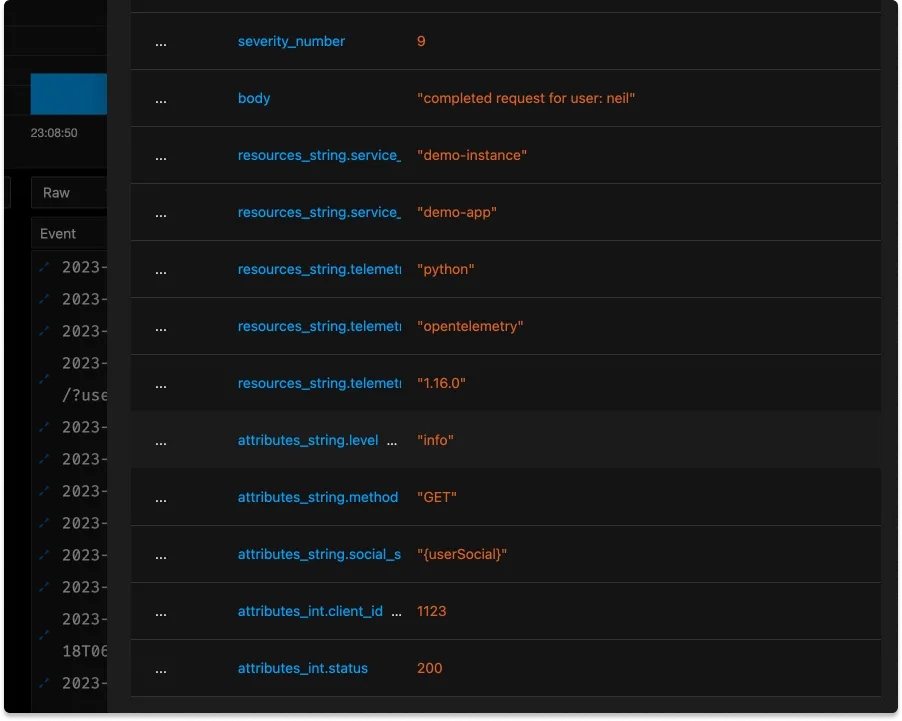
To add attributes to all lines logged by this collector, add a section to the processors to add an attribute. This example is a bit contrived, but let’s say that this collector is only gathering data for a single client organization:
attributes/clientid:
    actions:
      - key: client_id
        value: 1123
        action: insert
Adding this mapping, however, isn’t enough to add the attribute, we haven’t yet added this processor to our pipeline, check the pipelines mapping for logs:
logs:
      receivers: [otlp, tcplog/docker]
      processors: [logstransform/internal, batch]
      exporters: [clickhouselogsexporter]'
To actually affect our data, we must add it to the pipeline. The revised version looks like this:
logs:
      receivers: [otlp, tcplog/docker]
      processors: [attributes/clientid, logstransform/internal, batch]
      exporters: [clickhouselogsexporter]
Creating Log Fields
By default whenever you receive a log from a non OTLP receivers it will be stored directly in the body and you won't be able to filter logs based on fields/attributes. Opentelemetry provides different ways to parse attributes from your logs using different operators that the available. These parsed attributes are referred to as fields in signoz.
Ex :- Lets say we have our logs formatted as
{"time": "2022-09-20,15:27:17 +0530", "message": "Logging test...", "service": "python"}
Here we have a timestamp, a message and an attribute named service. Now we will have to parse these in our otel collector config.
receivers:
    ...
    filelog:
    include: [ /tmp/app.log ]
    start_at: beginning
    operators:
        - type: json_parser
        timestamp:
            parse_from: attributes.time
            layout: '%Y-%m-%d,%H:%M:%S %z'
        - type: move
        from: attributes.message
        to: body
        - type: remove
        field: attributes.time
...
- In the yaml file above we are using the json parser. This will parse the json log line and add it in the attributes key.
- Since we want to populate timestamp we are using the timestamp parser and pointing it to attributes.time which was parsed by the json parser.
- Now we want the value inside
messagekey to be in the log body, so we are moving it to body using move operator. - And finally we are removing time from attributes as we have already populated the value of timestamp from it.
Transforming Attributes
Logs data can be transformed arbitrarily using the OpenTelemetry Transformation Language (OTTL). It’s not necessary or practical to learn all the ins and outs of this language, but let’s start with a simple bit of processing that adds some useful attributes.
Within the processors section. we’ll add a transform
  transform:
    log_statements:
    - context: log
      statements:
        - set(severity_text, "FAIL") where body == "request failed"
When faced with excessively high cardinality data, it may be useful to 'crush' attribute values by replacing with generics. Here’s an example where some metric crushing will make our lives easier later
logs:
  replace_match(attributes["http.target"], "/user/*/list/*", "/user/{userId}/list/{listId}")
Removing Sensitive Data from Logs
The collector is one more place where you can control potentially sensitive data from being collected or transmitted. You can remove attributes with simple regex-style matching, like in this example where all values should be removed:
transform:
    log_statements:
    - context: log
      statements:
        - set(severity_text, "FAIL") where body == "request failed"
        - replace_match(attributes["social_security_number"], "*", "{userSocial}")
Or you can use pattern matching to find any strings that look similar:
  transform:
    log_statements:
    - context: log
      statements:
        - set(severity_text, "FAIL") where body == "request failed"
        - replace_all_patterns(attributes, "value", "^\\D*\\d{3}-\\d{2}-\\d{4}", "{ss_number}")
Remember that in these examples you'll need to add transform to the pipeline section of your config and restart the collector for these changes to take effect. The result is a value replaced with a placeholder
