Kubernetes Infra Metrics and Logs Collection
Overview
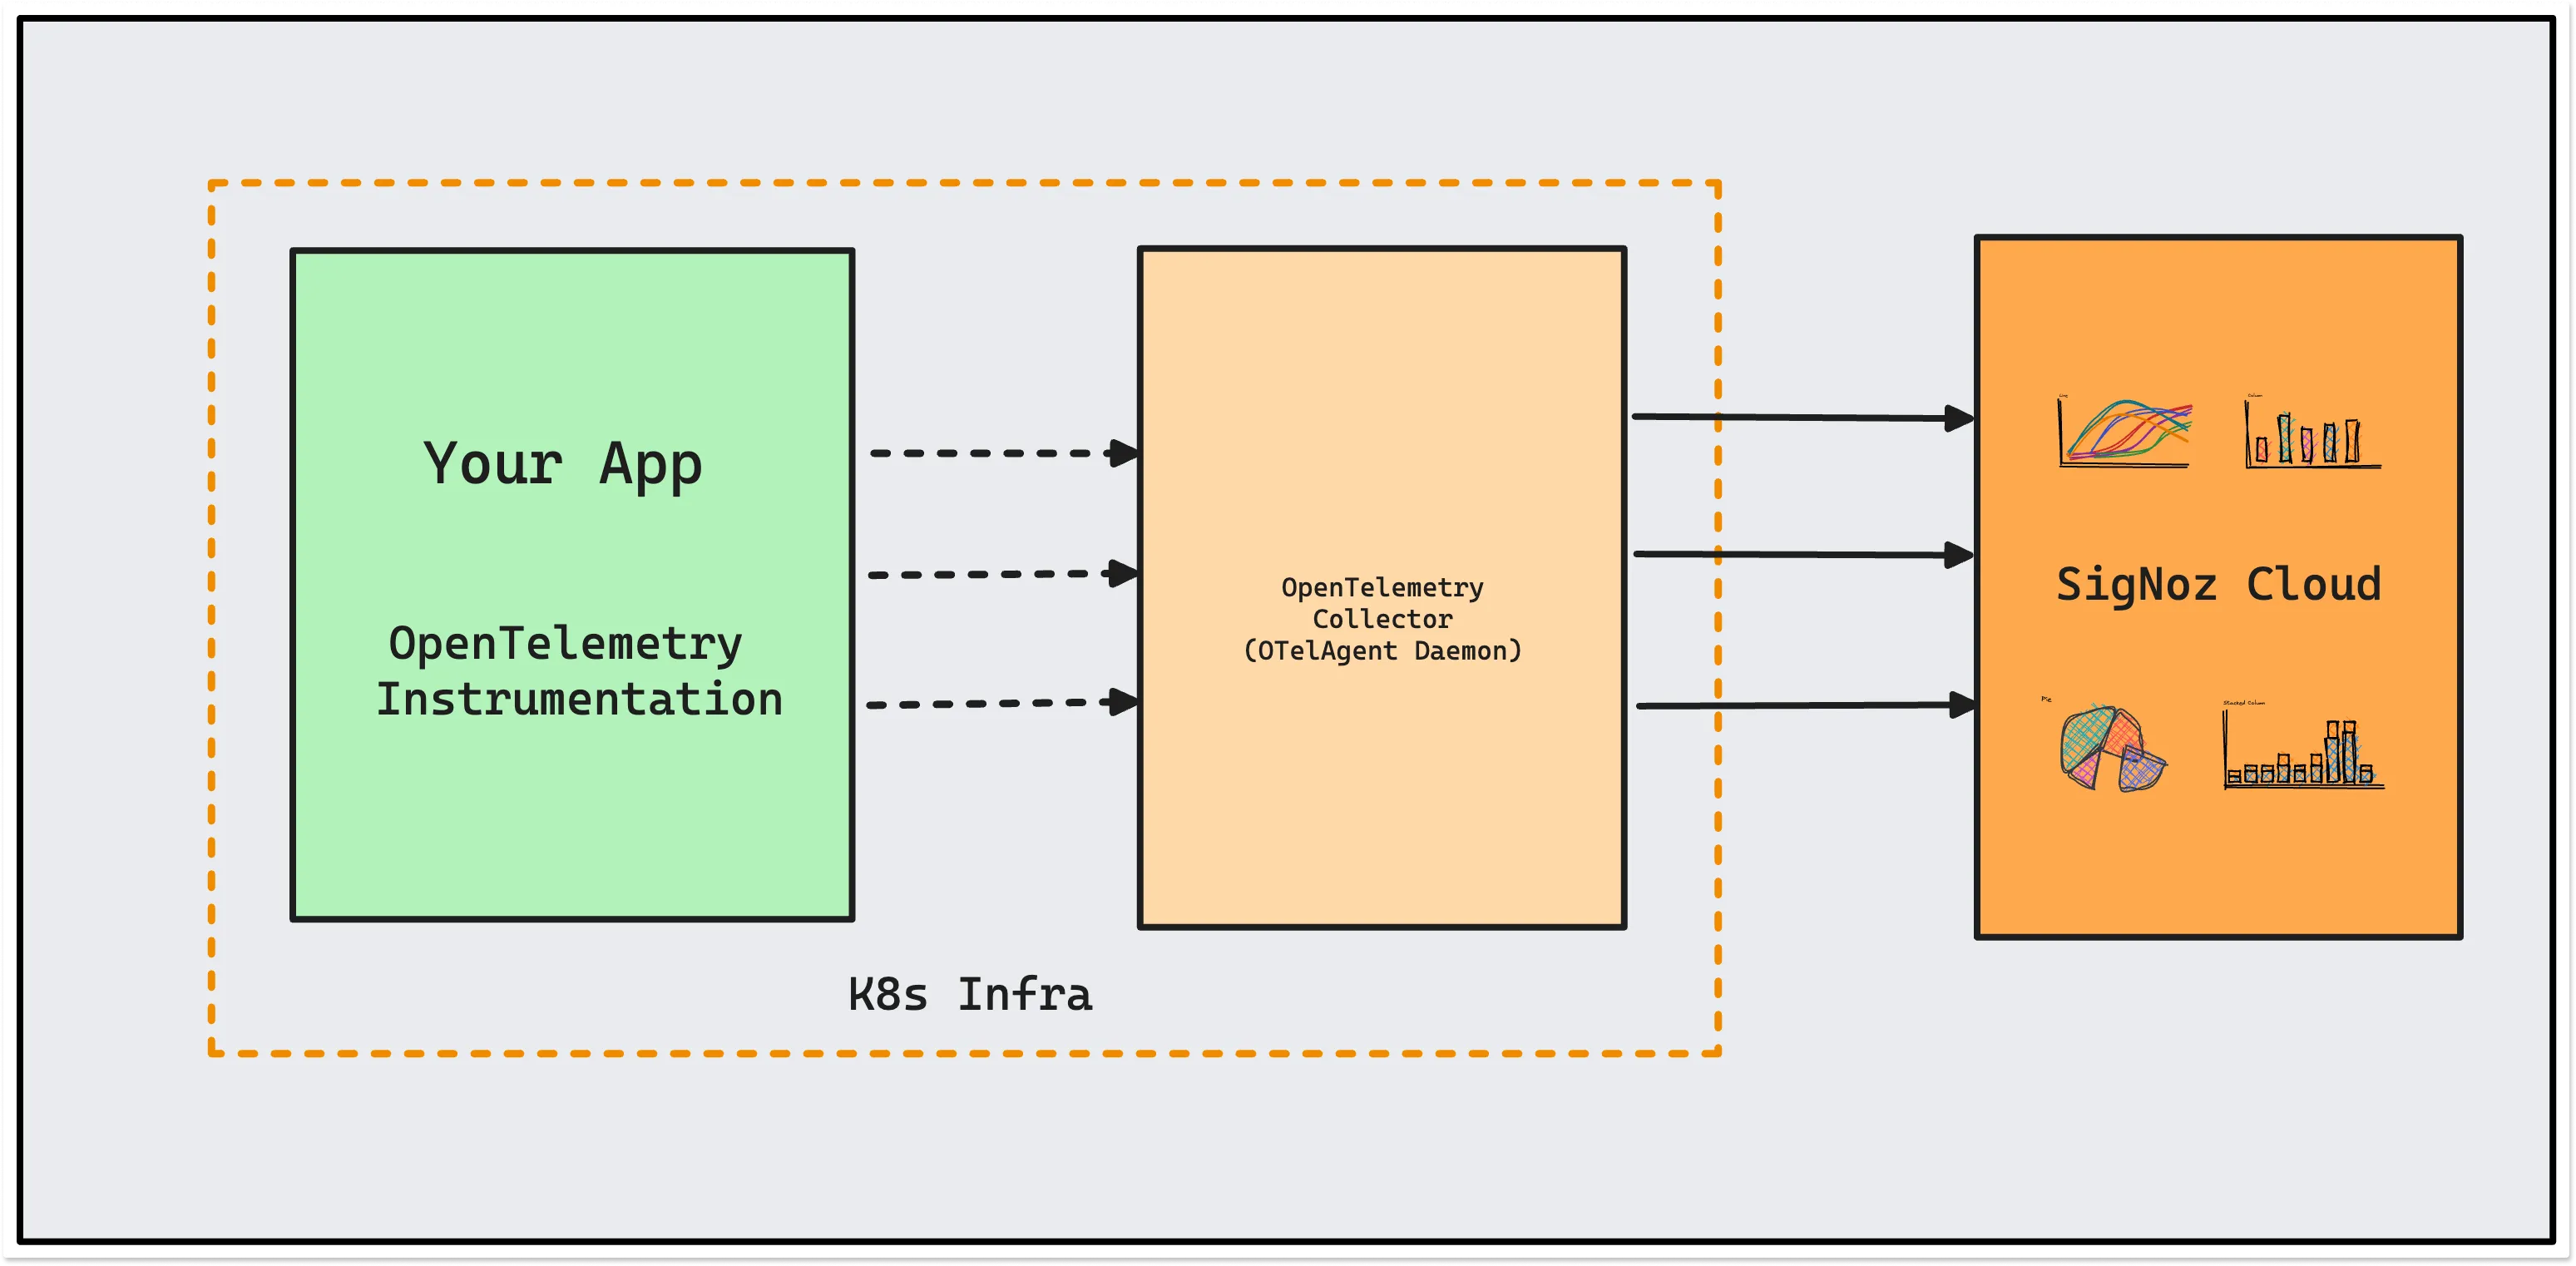
To export Kubernetes metrics, you can enable different receivers in OpenTelemetry collector which will send metrics about your Kubernetes infrastructure to SigNoz. These OpenTelemetry collectors will act as agents which send metrics about Kubernetes to SigNoz.
OtelCollector agent can also be used to tail and parse logs generated by
container using filelog receiver and send it to desired receiver.
K8s-Infra helm chart mainly does the following:
- Tails and parses logs generated by containers in Kubernetes cluster and sends to SigNoz
- Collects kubelet metrics and host metrics from each nodes of the Kubernetes cluster
- Collects cluster-level metrics from the Kubernetes API server
- Acts as a gateway to send any incoming OTLP telemetry data to SigNoz OtelCollector
Based on how you are running SigNoz (e.g. SigNoz Cloud, in an independent VM or Kubernetes cluster), you have to provide the address to send data from the above receivers.
- SigNoz Cloud
- Self-Host
Install K8s-Infra chart
To add the SigNoz Helm repository to your helm client, run the following command:
helm repo add signoz https://charts.signoz.io
If the chart is already present, update the chart to the latest version:
helm repo update
To install the k8s-infra chart, run the following command:
helm install my-release signoz/k8s-infra  \
  --set otelCollectorEndpoint=ingest.{region}.signoz.cloud:443 \
  --set otelInsecure=false \
  --set signozApiKey=<SIGNOZ_INGESTION_KEY> \
  --set global.clusterName=<CLUSTER_NAME>
Depending on the choice of your region for SigNoz cloud, the ingestion endpoint will vary according to this table.
| Region | Endpoint |
|---|---|
| US | ingest.us.signoz.cloud:443 |
| IN | ingest.in.signoz.cloud:443 |
| EU | ingest.eu.signoz.cloud:443 |
Note
- Replace
SIGNOZ_INGESTION_KEYwith the one provided by SigNoz. - Replace
<CLUSTER_NAME>with the name of the Kubernetes cluster or a unique identifier of the cluster.
Send data from applications to OtelCollectors in your infra

To send data from your applications, you must first instrument it with OpenTelemetry. You can find instrumentation instructions for your specific language here.
Once you're done instrumenting your application, add below to your application manifest files for applications to start sending data to the otel-collectors running as daemonset. Eg. add the below config to the deployment.yaml of your application.
env:
  - name: HOST_IP
    valueFrom:
      fieldRef:
        fieldPath: status.hostIP
  - name: K8S_POD_IP
    valueFrom:
      fieldRef:
        apiVersion: v1
        fieldPath: status.podIP
  - name: K8S_POD_UID
    valueFrom:
      fieldRef:
        fieldPath: metadata.uid
  - name: OTEL_EXPORTER_OTLP_INSECURE
    value: "true"
  - name: OTEL_EXPORTER_OTLP_ENDPOINT
    value: $(HOST_IP):4317
  - name: OTEL_RESOURCE_ATTRIBUTES
    value: service.name=APPLICATION_NAME,k8s.pod.ip=$(K8S_POD_IP),k8s.pod.uid=$(K8S_POD_UID)
Note
- Replace
APPLICATION_NAMEwith your application name that you wish to see in SigNoz. - In cases of some SDKs, you would have to include
https://prefix forOTEL_EXPORTER_OTLP_ENDPOINT
By default, SigNoz Helm chart installs k8s-infra dependency chart which
handles the task of collecting metrics and logs from the Kubernetes cluster.
If you have single Kubernetes cluster for SigNoz and your applications,
you need not install k8s-infra chart.
Install K8s-Infra chart
To add the SigNoz Helm repository to your helm client, run the following command:
helm repo add signoz https://charts.signoz.io
If the chart is already present, update the chart to the latest version:
helm repo update
To install the k8s-infra chart, run the following command:
helm install my-release signoz/k8s-infra  \
--set otelCollectorEndpoint=<IP-or-Endpoint-of-SigNoz-OtelCollector>:4317
If the OtelCollector endpoint is secured, you would have to enable otelInsecure
configuration and often make other changes such as including either config
or path to the TLS certificate and private key.
Disable Logs Collection
In case you do not want to collect logs from your Kubernetes cluster, you
can disable using presets in k8s-infra chart.
presets:
  logsCollection:
    enabled: false
Disable Metrics Collection
In case you do not want to collect metrics from your Kubernetes cluster, you
can disable using presets in k8s-infra chart.
presets:
  hostMetrics:
    enabled: false
  kubeletMetrics:
    enabled: false
  clusterMetrics:
    enabled: false

otelDeployment:
  enabled: false
Plot Metrics in SigNoz UI
To plot metrics generated from k8s-infra chart, follow the instructions given in the docs here.
Check out the List of metrics from Kubernetes receiver.
Here are some examples of metrics dashboard.
Import Dashboard with PVC Metrics
You can import dashboard with PVC metrics of Kubernetes cluster from here.
Import Dashboard with Overall Kubernetes pods Metrics
You can import dashboard with the general Kubernetes pods metrics of your K8s cluster from here.
Import Dashboard with Detailed Kubernetes pods Metrics
You can import dashboard with more detailed granular Kubernetes pods metrics of your K8s cluster from here.
Import Dashboard with Overall Kubernetes Node Metrics
You can import dashboard with the general Kubernetes node metrics of your K8s cluster from here.
Import Dashboard with Detailed Kubernetes Node Metrics
You can import dashboard with more detailed granular Kubernetes node metrics of your K8s cluster from here.
In the Dashboard page of SigNoz UI, you can create your own widgets as per you need using metrics from the list below.
List of metrics
Kubernetes Metrics - kubeletstats and k8s_cluster
- container_cpu_time
- container_cpu_utilization
- container_filesystem_available
- container_filesystem_capacity
- container_filesystem_usage
- container_memory_available
- container_memory_major_page_faults
- container_memory_page_faults
- container_memory_rss
- container_memory_usage
- container_memory_working_set
- k8s_container_cpu_limit
- k8s_container_cpu_request
- k8s_container_memory_limit
- k8s_container_memory_request
- k8s_container_ready
- k8s_container_restarts
- k8s_daemonset_current_scheduled_nodes
- k8s_daemonset_desired_scheduled_nodes
- k8s_daemonset_misscheduled_nodes
- k8s_daemonset_ready_nodes
- k8s_deployment_available
- k8s_deployment_desired
- k8s_job_active_pods
- k8s_job_desired_successful_pods
- k8s_job_failed_pods
- k8s_job_max_parallel_pods
- k8s_job_successful_pods
- k8s_namespace_phase
- k8s_node_condition_memory_pressure
- k8s_node_condition_ready
- k8s_node_cpu_time
- k8s_node_cpu_utilization
- k8s_node_filesystem_available
- k8s_node_filesystem_capacity
- k8s_node_filesystem_usage
- k8s_node_memory_available
- k8s_node_memory_major_page_faults
- k8s_node_memory_page_faults
- k8s_node_memory_rss
- k8s_node_memory_usage
- k8s_node_memory_working_set
- k8s_node_network_errors
- k8s_node_network_io
- k8s_pod_cpu_time
- k8s_pod_cpu_utilization
- k8s_pod_filesystem_available
- k8s_pod_filesystem_capacity
- k8s_pod_filesystem_usage
- k8s_pod_memory_available
- k8s_pod_memory_major_page_faults
- k8s_pod_memory_page_faults
- k8s_pod_memory_rss
- k8s_pod_memory_usage
- k8s_pod_memory_working_set
- k8s_pod_network_errors
- k8s_pod_network_io
- k8s_pod_phase
- k8s_replicaset_available
- k8s_replicaset_desired
- k8s_statefulset_current_pods
- k8s_statefulset_desired_pods
- k8s_statefulset_ready_pods
- k8s_statefulset_updated_pods
- k8s_volume_available
- k8s_volume_capacity
- k8s_volume_inodes
- k8s_volume_inodes_free
- k8s_volume_inodes_used
- k8s_node_allocatable_cpu
- k8s_node_allocatable_memory
Node Hostmetrics - hostmetrics
- system_network_connections
- system_disk_weighted_io_time
- system_disk_merged
- system_disk_operation_time
- system_disk_pending_operations
- system_disk_io_time
- system_disk_operations
- system_disk_io
- system_filesystem_inodes_usage
- system_filesystem_usage
- system_cpu_time
- system_memory_usage
- system_network_packets
- system_network_dropped
- system_network_io
- system_network_errors
- system_cpu_load_average_5m
- system_cpu_load_average_15m
- system_cpu_load_average_1m