JBoss OpenTelemetry Instrumentation
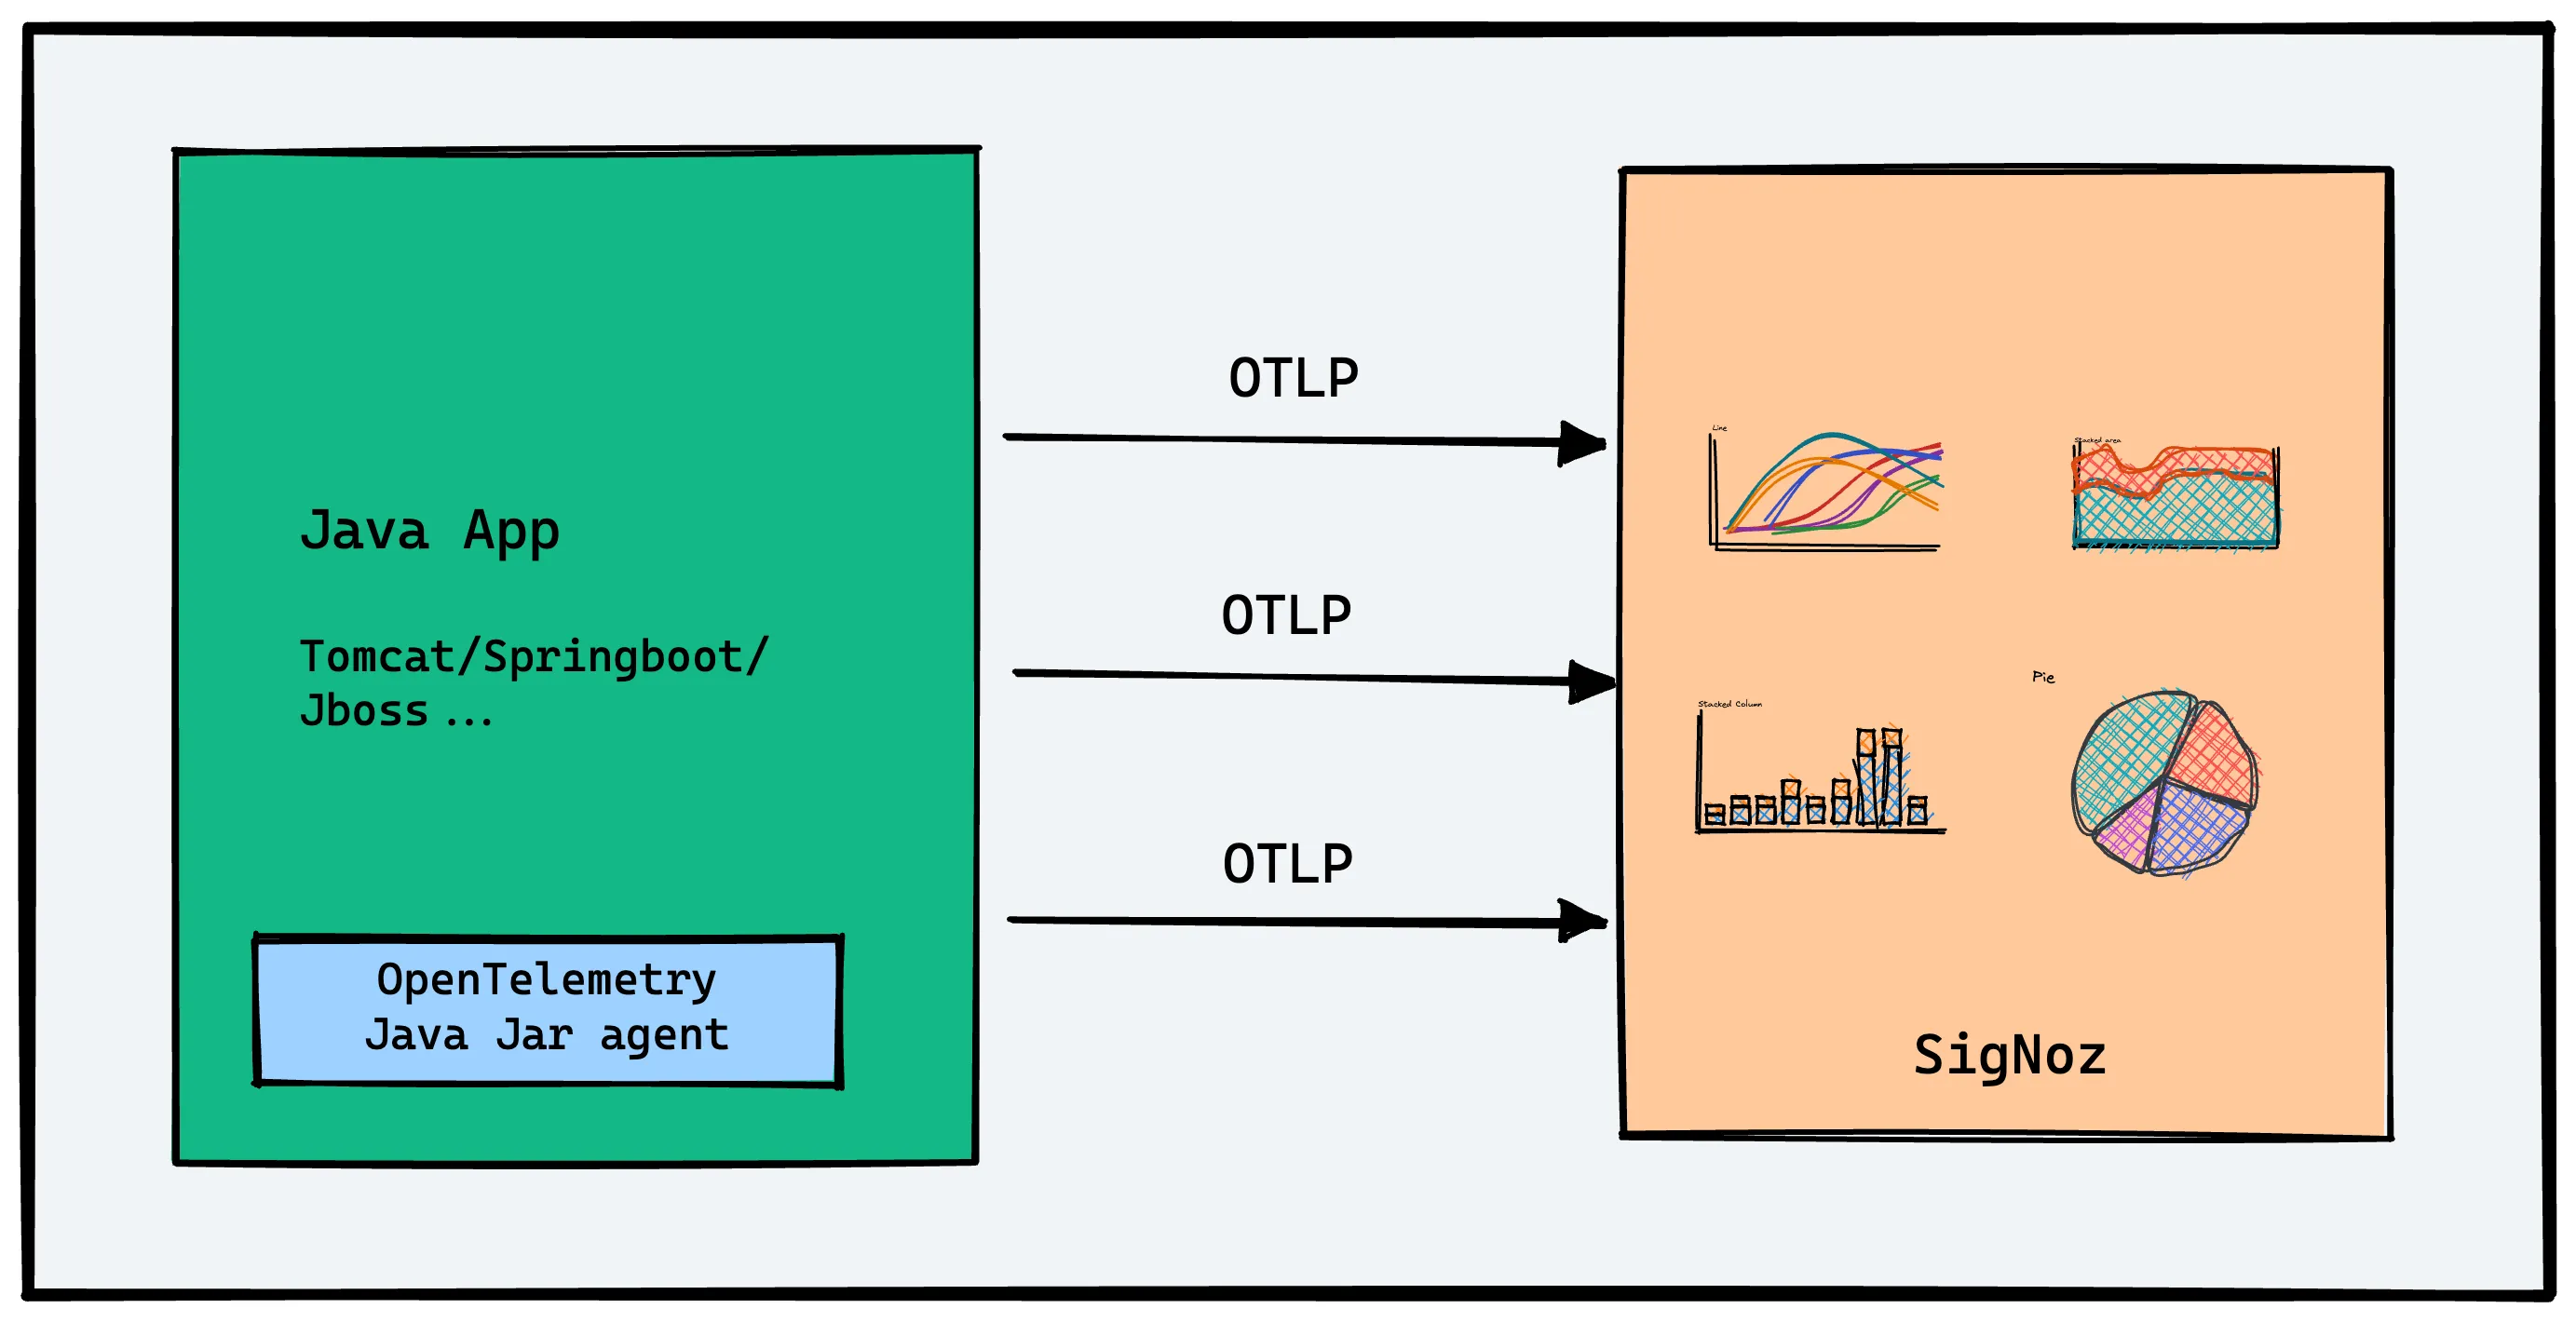
This document contains instructions on how to set up OpenTelemetry instrumentation in your JBoss applications. OpenTelemetry, also known as OTel for short, is an open source observability framework that can help you generate and collect telemetry data - traces, metrics, and logs from your JBoss application.
OpenTelemetry Java is the language-specific implementation of OpenTelemetry in Java that can be used to instrument JBoss applications.
Once the telemetry data is collected, you can configure an exporter to send the data to SigNoz.
There are three major steps to using OpenTelemetry:
- Instrumenting your JBoss application with OpenTelemetry
- Configuring exporter to send data to SigNoz
- Validating that configuration to ensure that data is being sent as expected.

There are two types of application instrumentation:
Auto Instrumentation
A completely automatic and out of box experience, with minimal code changes. For your JBoss application, we recommend getting started with auto instrumentation.Manual Instrumentation
It involves writing instrumentation using OpenTelemetry SDK and API manually. You would need to get a handle to an instance of theOpenTelemetryinterface, acquire a tracer, and create spans manually.
Let’s understand how to download, install, and run OpenTelemetry in a JBoss application.
Requirements
Java 8 or higher
Send Traces to SigNoz Cloud
OpenTelemetry provides a handy Java JAR agent that can be attached to any Java 8+ application and dynamically injects bytecode to capture telemetry from a number of popular libraries and frameworks.
Based on your application environment, you can choose the setup below to send traces to SigNoz Cloud.
- VM
- Kubernetes
From VMs, there are two ways to send data to SigNoz Cloud.
Send traces directly to SigNoz Cloud
OpenTelemetry Java agent can send traces directly to SigNoz Cloud.
Step 1. Download otel java binary agent
wget https://github.com/open-telemetry/opentelemetry-java-instrumentation/releases/latest/download/opentelemetry-javaagent.jar
Step 2. Open the configuration file
vim /opt/jboss-eap-7.1/bin/standalone.conf
Step 3. Update JAVA_OPTS environment variable
Update JAVA_OPTS environment variable with configurations required to send data to SigNoz cloud in your configuration file.
JAVA_OPTS="-javaagent:/path/opentelemetry-javaagent.jar
-Dotel.exporter.otlp.endpoint=https://ingest.{region}.signoz.cloud:443
-Dotel.exporter.otlp.headers="signoz-access-token=SIGNOZ_INGESTION_KEY"
-Dotel.resource.attributes="service.name=<app_name>""
You need to replace the following things based on your environment:
path- Update it to the path of your downloaded Java JAR agent.<app_name>is the name for your applicationSIGNOZ_INGESTION_KEYis the API token provided by SigNoz. You can find your ingestion key from SigNoz cloud account details sent on your email.
Depending on the choice of your region for SigNoz cloud, the ingest endpoint will vary according to this table.
| Region | Endpoint |
|---|---|
| US | ingest.us.signoz.cloud:443 |
| IN | ingest.in.signoz.cloud:443 |
| EU | ingest.eu.signoz.cloud:443 |
Step 4. [Optional] Write the output/logs of standalone.sh script to a file nohup.out as a background thread
/opt/jboss-eap-7.1/bin/standalone.sh > /opt/jboss-eap-7.1/bin/nohup.out &
In case you encounter an issue where all applications do not get listed in the services section then please refer to the troubleshooting section.
Send traces via OTel Collector binary
OTel Collector binary helps to collect logs, hostmetrics, resource and infra attributes. It is recommended to install Otel Collector binary to collect and send traces to SigNoz cloud. You can correlate signals and have rich contextual data through this way.
You can find instructions to install OTel Collector binary here in your VM. Once you are done setting up your OTel Collector binary, you can follow the below steps for instrumenting your Java application.
Step 1. Download OTel java binary agent
wget https://github.com/open-telemetry/opentelemetry-java-instrumentation/releases/latest/download/opentelemetry-javaagent.jar
Step 2. Open the configuration file
vim /opt/jboss-eap-7.1/bin/standalone.conf
Step 3. Update JAVA_OPTS environment variable
Update JAVA_OPTS environment variable with configurations required to send data to SigNoz cloud in your configuration file.
JAVA_OPTS="-javaagent:/path/opentelemetry-javaagent.jar"
where,
path- Update it to the path of your downloaded Java JAR agent.
In case you encounter an issue where all applications do not get listed in the services section then please refer to the troubleshooting section.
For Java application deployed on Kubernetes, you need to install OTel Collector agent in your k8s infra to collect and send traces to SigNoz Cloud. You can find the instructions to install OTel Collector agent here.
Once you have set up OTel Collector agent, you can proceed with OpenTelemetry java instrumentation by following the below steps:
Step 1. Download otel java binary
wget https://github.com/open-telemetry/opentelemetry-java-instrumentation/releases/latest/download/opentelemetry-javaagent.jar
Step 2. Open the configuration file
vim /opt/jboss-eap-7.1/bin/standalone.conf
Step 3. Update JAVA_OPTS environment variable
Update JAVA_OPTS environment variable with configurations required to send data to SigNoz cloud in your configuration file.
JAVA_OPTS="-javaagent:/path/opentelemetry-javaagent.jar"
where,
path- Update it to the path of your downloaded Java JAR agent.
Step 4. Make sure to dockerise your application along with OpenTelemetry instrumentation.
You can validate if your application is sending traces to SigNoz cloud by following the instructions here.
In case you encounter an issue where all applications do not get listed in the services section then please refer to the troubleshooting section.
Send Traces to Self-Hosted SigNoz
You can use OpenTelemetry Java to send your traces directly to SigNoz. OpenTelemetry provides a handy Java JAR agent that can be attached to any Java 8+ application and dynamically injects bytecode to capture telemetry from a number of popular libraries and frameworks.
Steps to auto-instrument JBoss applications for traces
OpenTelemetry Java auto-instrumentation supports collecting telemetry data from a huge number of libraries and frameworks. You can check out the full list here.
Download the latest OpenTelemetry Java JAR agent
Download the latest Java JAR agent. You can also use the terminal to get the file using the following command:wget https://github.com/open-telemetry/opentelemetry-java-instrumentation/releases/latest/download/opentelemetry-javaagent.jarOpen the configuration file
vim /opt/jboss-eap-7.1/bin/standalone.confUpdate
JAVA_OPTSenvironment variable
UpdateJAVA_OPTSenvironment variable with configurations required for OpenTelemetry in your configuration file.JAVA_OPTS="-javaagent:/path/opentelemetry-javaagent.jar
-Dotel.exporter.otlp.endpoint=http://<IP of SigNoz Backend>:4317
-Dotel.resource.attributes="service.name=<app_name>""You need to replace the following things based on your environment:
path- Update it to the path of your downloaded Java JAR agent.
IP of SigNoz Backend- This is the endpoint of the machine where SigNoz is installed.
app_name- Replace it with your app name. It will show up under the list ofServicesin SigNoz.Here’s a handy grid to figure out which address to use to send data to SigNoz.
[Optional] Write the output/logs of standalone.sh script to a file nohup.out as a background thread
/opt/jboss-eap-7.1/bin/standalone.sh > /opt/jboss-eap-7.1/bin/nohup.out &
💡 Remember to allow incoming requests to port 4317 of the machine where SigNoz backend is hosted.
In case you encounter an issue where all applications do not get listed in the services section then please refer to the troubleshooting section.
Validating instrumentation by checking for traces
With your application running, you can verify that you’ve instrumented your application with OpenTelemetry correctly by confirming that tracing data is being reported to SigNoz.
To do this, you need to ensure that your application generates some data. Applications will not produce traces unless they are being interacted with, and OpenTelemetry will often buffer data before sending. So you need to interact with your application and wait for some time to see your tracing data in SigNoz.
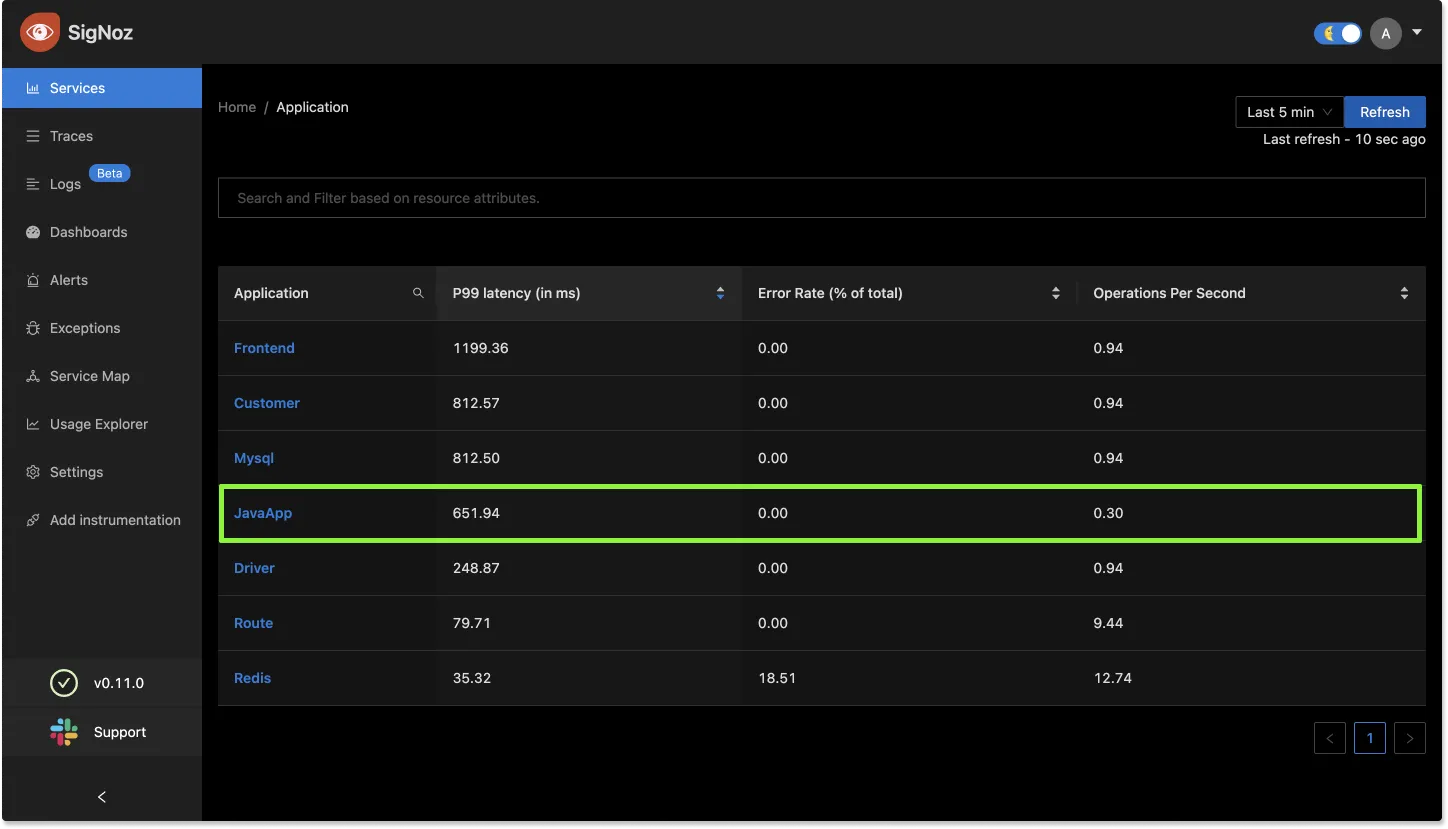
Validate your traces in SigNoz:
- Trigger an action in your app that generates a web request. Hit the endpoint a number of times to generate some data. Then, wait for some time.
- In SigNoz, open the
Servicestab. Hit theRefreshbutton on the top right corner, and your application should appear in the list ofApplications. - Go to the
Tracestab, and apply relevant filters to see your application’s traces.
You might see other dummy applications if you’re using SigNoz for the first time. You can remove it by following the docs here.

Configuring the agent
The agent is highly configurable. You can check out all the configuration options available here.
Disabled instrumentations
Some instrumentations can produce too many spans and make traces very noisy. For this reason, the following instrumentations are disabled by default:
jdbc-datasourcewhich creates spans whenever thejava.sql.DataSource#getConnectionmethod is called.dropwizard-metrics, which might create very low-quality metrics data because of the lack of label/attribute support in the Dropwizard metrics API.
To enable them, add the otel.instrumentation.<name>.enabled system property: -Dotel.instrumentation.jdbc-datasource.enabled=true
Manual Instrumentation
For manual instrumentation of Java application, refer to the docs here.
Troubleshooting your installation
If spans are not being reported to SigNoz, try running in debug mode by setting OTEL_LOG_LEVEL=debug:
The debug log level will print out the configuration information. It will also emit every span to the console, which should look something like:
Span {
  attributes: {},
  links: [],
  events: [],
  status: { code: 0 },
  endTime: [ 1597810686, 885498645 ],
  _ended: true,
  _duration: [ 0, 43333 ],
  name: 'bar',
  spanContext: {
    traceId: 'eca3cc297720bd705e734f4941bca45a',
    spanId: '891016e5f8c134ad',
    traceFlags: 1,
    traceState: undefined
  },
  parentSpanId: 'cff3a2c6bfd4bbef',
  kind: 0,
  startTime: [ 1597810686, 885455312 ],
  resource: Resource { labels: [Object] },
  instrumentationLibrary: { name: 'example', version: '*' },
  _logger: ConsoleLogger {
    debug: [Function],
    info: [Function],
    warn: [Function],
    error: [Function]
  },
  _traceParams: {
    numberOfAttributesPerSpan: 32,
    numberOfLinksPerSpan: 32,
    numberOfEventsPerSpan: 128
  },
  _spanProcessor: MultiSpanProcessor { _spanProcessors: [Array] }
},
Sample Java Application
- We have included a sample Java application with README.md at Sample Java App Github Repo.
Frequently Asked Questions
How to find what to use in
IP of SigNozif I have installed SigNoz in Kubernetes cluster?Based on where you have installed your application and where you have installed SigNoz, you need to find the right value for this. Please use this grid to find the value you should use for
IP of SigNozI am sending data from my application to SigNoz, but I don't see any events or graphs in the SigNoz dashboard. What should I do?
This could be because of one of the following reasons:
Your application is generating telemetry data, but not able to connect with SigNoz installation
Please use this troubleshooting guide to find if your application is able to access SigNoz installation and send data to it.
Your application is not actually generating telemetry data
Please check if the application is generating telemetry data first. You can use
Console Exporterto just print your telemetry data in console first. Join our Slack Community if you need help on how to export your telemetry data in consoleYour SigNoz installation is not running or behind a firewall
Please double check if the pods in SigNoz installation are running fine.
docker psorkubectl get pods -n platformare your friends for this.