Javascript OpenTelemetry Instrumentation
This document contains OpenTelemetry instrumentation instructions for Javascript backend frameworks and modules based on Nodejs. If you're using self-hosted SigNoz refer to this section. If you're using SigNoz cloud, refer to this section.
Send traces to SigNoz Cloud
Based on your application environment, you can choose the setup below to send traces to SigNoz Cloud.
- VM
- Kubernetes
From VMs, there are two ways to send data to SigNoz Cloud.
Send traces directly to SigNoz Cloud
Step 1. Install OpenTelemetry packages
npm install --save @opentelemetry/api@^1.6.0
npm install --save @opentelemetry/sdk-node@^0.45.0
npm install --save @opentelemetry/auto-instrumentations-node@^0.39.4
npm install --save @opentelemetry/exporter-trace-otlp-http@^0.45.0
Step 2. Create tracing.js file
You need to configure the endpoint for SigNoz cloud in this file. You can find your ingestion key from SigNoz cloud account details sent on your email.
// tracing.js
'use strict'
const process = require('process');
const opentelemetry = require('@opentelemetry/sdk-node');
const { getNodeAutoInstrumentations } = require('@opentelemetry/auto-instrumentations-node');
const { OTLPTraceExporter } = require('@opentelemetry/exporter-trace-otlp-http');
const { Resource } = require('@opentelemetry/resources');
const { SemanticResourceAttributes } = require('@opentelemetry/semantic-conventions');

// do not set headers in exporterOptions, the OTel spec recommends setting headers through ENV variables
// https://github.com/open-telemetry/opentelemetry-specification/blob/main/specification/protocol/exporter.md#specifying-headers-via-environment-variables

const exporterOptions = {
  url: 'https://ingest.{region}.signoz.cloud:443/v1/traces'
}

const traceExporter = new OTLPTraceExporter(exporterOptions);
const sdk = new opentelemetry.NodeSDK({
  traceExporter,
  instrumentations: [getNodeAutoInstrumentations()],
  resource: new Resource({
    [SemanticResourceAttributes.SERVICE_NAME]: 'node_app'
  })
});

// initialize the SDK and register with the OpenTelemetry API
// this enables the API to record telemetry
sdk.start()

// gracefully shut down the SDK on process exit
process.on('SIGTERM', () => {
  sdk.shutdown()
    .then(() => console.log('Tracing terminated'))
    .catch((error) => console.log('Error terminating tracing', error))
    .finally(() => process.exit(0));
});
Depending on the choice of your region for SigNoz cloud, the ingest endpoint will vary according to this table.
| Region | Endpoint |
|---|---|
| US | ingest.us.signoz.cloud:443/v1/traces |
| IN | ingest.in.signoz.cloud:443/v1/traces |
| EU | ingest.eu.signoz.cloud:443/v1/traces |
Step 3. Run the application
Make sure you set the OTEL_EXPORTER_OTLP_HEADERS env as follows
OTEL_EXPORTER_OTLP_HEADERS="signoz-access-token=<SIGNOZ_INGESTION_KEY>" node -r ./tracing.js app.js
SIGNOZ_INGESTION_KEY is the API token provided by SigNoz. You can find your ingestion key from SigNoz cloud account details sent on your email.
Step 4. You can validate if your application is sending traces to SigNoz cloud here.
In case you encounter an issue where all applications do not get listed in the services section then please refer to the troubleshooting section.
Send traces via OTel Collector binary
OTel Collector binary helps to collect logs, hostmetrics, resource and infra attributes. It is recommended to install Otel Collector binary to collect and send traces to SigNoz cloud. You can correlate signals and have rich contextual data through this way.
You can find instructions to install OTel Collector binary here in your VM. Once you are done setting up your OTel Collector binary, you can follow the below steps for instrumenting your Javascript application.
Step 1. Install OpenTelemetry packages
npm install --save @opentelemetry/api@^1.6.0
npm install --save @opentelemetry/sdk-node@^0.45.0
npm install --save @opentelemetry/auto-instrumentations-node@^0.39.4
npm install --save @opentelemetry/exporter-trace-otlp-http@^0.45.0
Step 2. Create tracing.js file
// tracing.js
'use strict'
const process = require('process');
const opentelemetry = require('@opentelemetry/sdk-node');
const { getNodeAutoInstrumentations } = require('@opentelemetry/auto-instrumentations-node');
const { OTLPTraceExporter } = require('@opentelemetry/exporter-trace-otlp-http');
const { Resource } = require('@opentelemetry/resources');
const { SemanticResourceAttributes } = require('@opentelemetry/semantic-conventions');

const exporterOptions = {
  url: process.env.OTEL_EXPORTER_OTLP_ENDPOINT || 'http://localhost:4318/v1/traces',
}

const traceExporter = new OTLPTraceExporter(exporterOptions);
const sdk = new opentelemetry.NodeSDK({
  traceExporter,
  instrumentations: [getNodeAutoInstrumentations()],
  resource: new Resource({
    [SemanticResourceAttributes.SERVICE_NAME]: 'node_app'
  })
});

// initialize the SDK and register with the OpenTelemetry API
// this enables the API to record telemetry
sdk.start()

// gracefully shut down the SDK on process exit
process.on('SIGTERM', () => {
  sdk.shutdown()
    .then(() => console.log('Tracing terminated'))
    .catch((error) => console.log('Error terminating tracing', error))
    .finally(() => process.exit(0));
});
Step 3. Run the application
node -r ./tracing.js app.js
Step 4. You can validate if your application is sending traces to SigNoz cloud here.
In case you encounter an issue where all applications do not get listed in the services section then please refer to the troubleshooting section.
For Javascript application deployed on Kubernetes, you need to install OTel Collector agent in your k8s infra to collect and send traces to SigNoz Cloud. You can find the instructions to install OTel Collector agent here.
In case you encounter an issue where all applications do not get listed in the services section then please refer to the troubleshooting section.
Once you have set up OTel Collector agent, you can proceed with OpenTelemetry Javascript instrumentation by following the below steps:
Step 1. Install OpenTelemetry packages
npm install --save @opentelemetry/api@^1.6.0
npm install --save @opentelemetry/sdk-node@^0.45.0
npm install --save @opentelemetry/auto-instrumentations-node@^0.39.4
npm install --save @opentelemetry/exporter-trace-otlp-http@^0.45.0
Step 2. Create tracing.js file
// tracing.js
'use strict'
const process = require('process');
const opentelemetry = require('@opentelemetry/sdk-node');
const { getNodeAutoInstrumentations } = require('@opentelemetry/auto-instrumentations-node');
const { OTLPTraceExporter } = require('@opentelemetry/exporter-trace-otlp-http');
const { Resource } = require('@opentelemetry/resources');
const { SemanticResourceAttributes } = require('@opentelemetry/semantic-conventions');

const exporterOptions = {
  url: process.env.OTEL_EXPORTER_OTLP_ENDPOINT || 'http://localhost:4318/v1/traces',
}

const traceExporter = new OTLPTraceExporter(exporterOptions);
const sdk = new opentelemetry.NodeSDK({
  traceExporter,
  instrumentations: [getNodeAutoInstrumentations()],
  resource: new Resource({
    [SemanticResourceAttributes.SERVICE_NAME]: 'node_app'
  })
});

// initialize the SDK and register with the OpenTelemetry API
// this enables the API to record telemetry
sdk.start()

// gracefully shut down the SDK on process exit
process.on('SIGTERM', () => {
  sdk.shutdown()
    .then(() => console.log('Tracing terminated'))
    .catch((error) => console.log('Error terminating tracing', error))
    .finally(() => process.exit(0));
});
Step 3. Run the application
node -r ./tracing.js app.js
Step 4. You can validate if your application is sending traces to SigNoz cloud here.
In case you encounter an issue where all applications do not get listed in the services section then please refer to the troubleshooting section.
Send Traces to Self-Hosted SigNoz
Requirements
- Node.js version 14 or newer (See here)
You can use OpenTelemetry Nodejs client libraries to send your traces directly to SigNoz. You have two choices for instrumenting your Nodejs application with OpenTelemetry.
- Use the all-in-one auto-instrumentation library(Recommended)
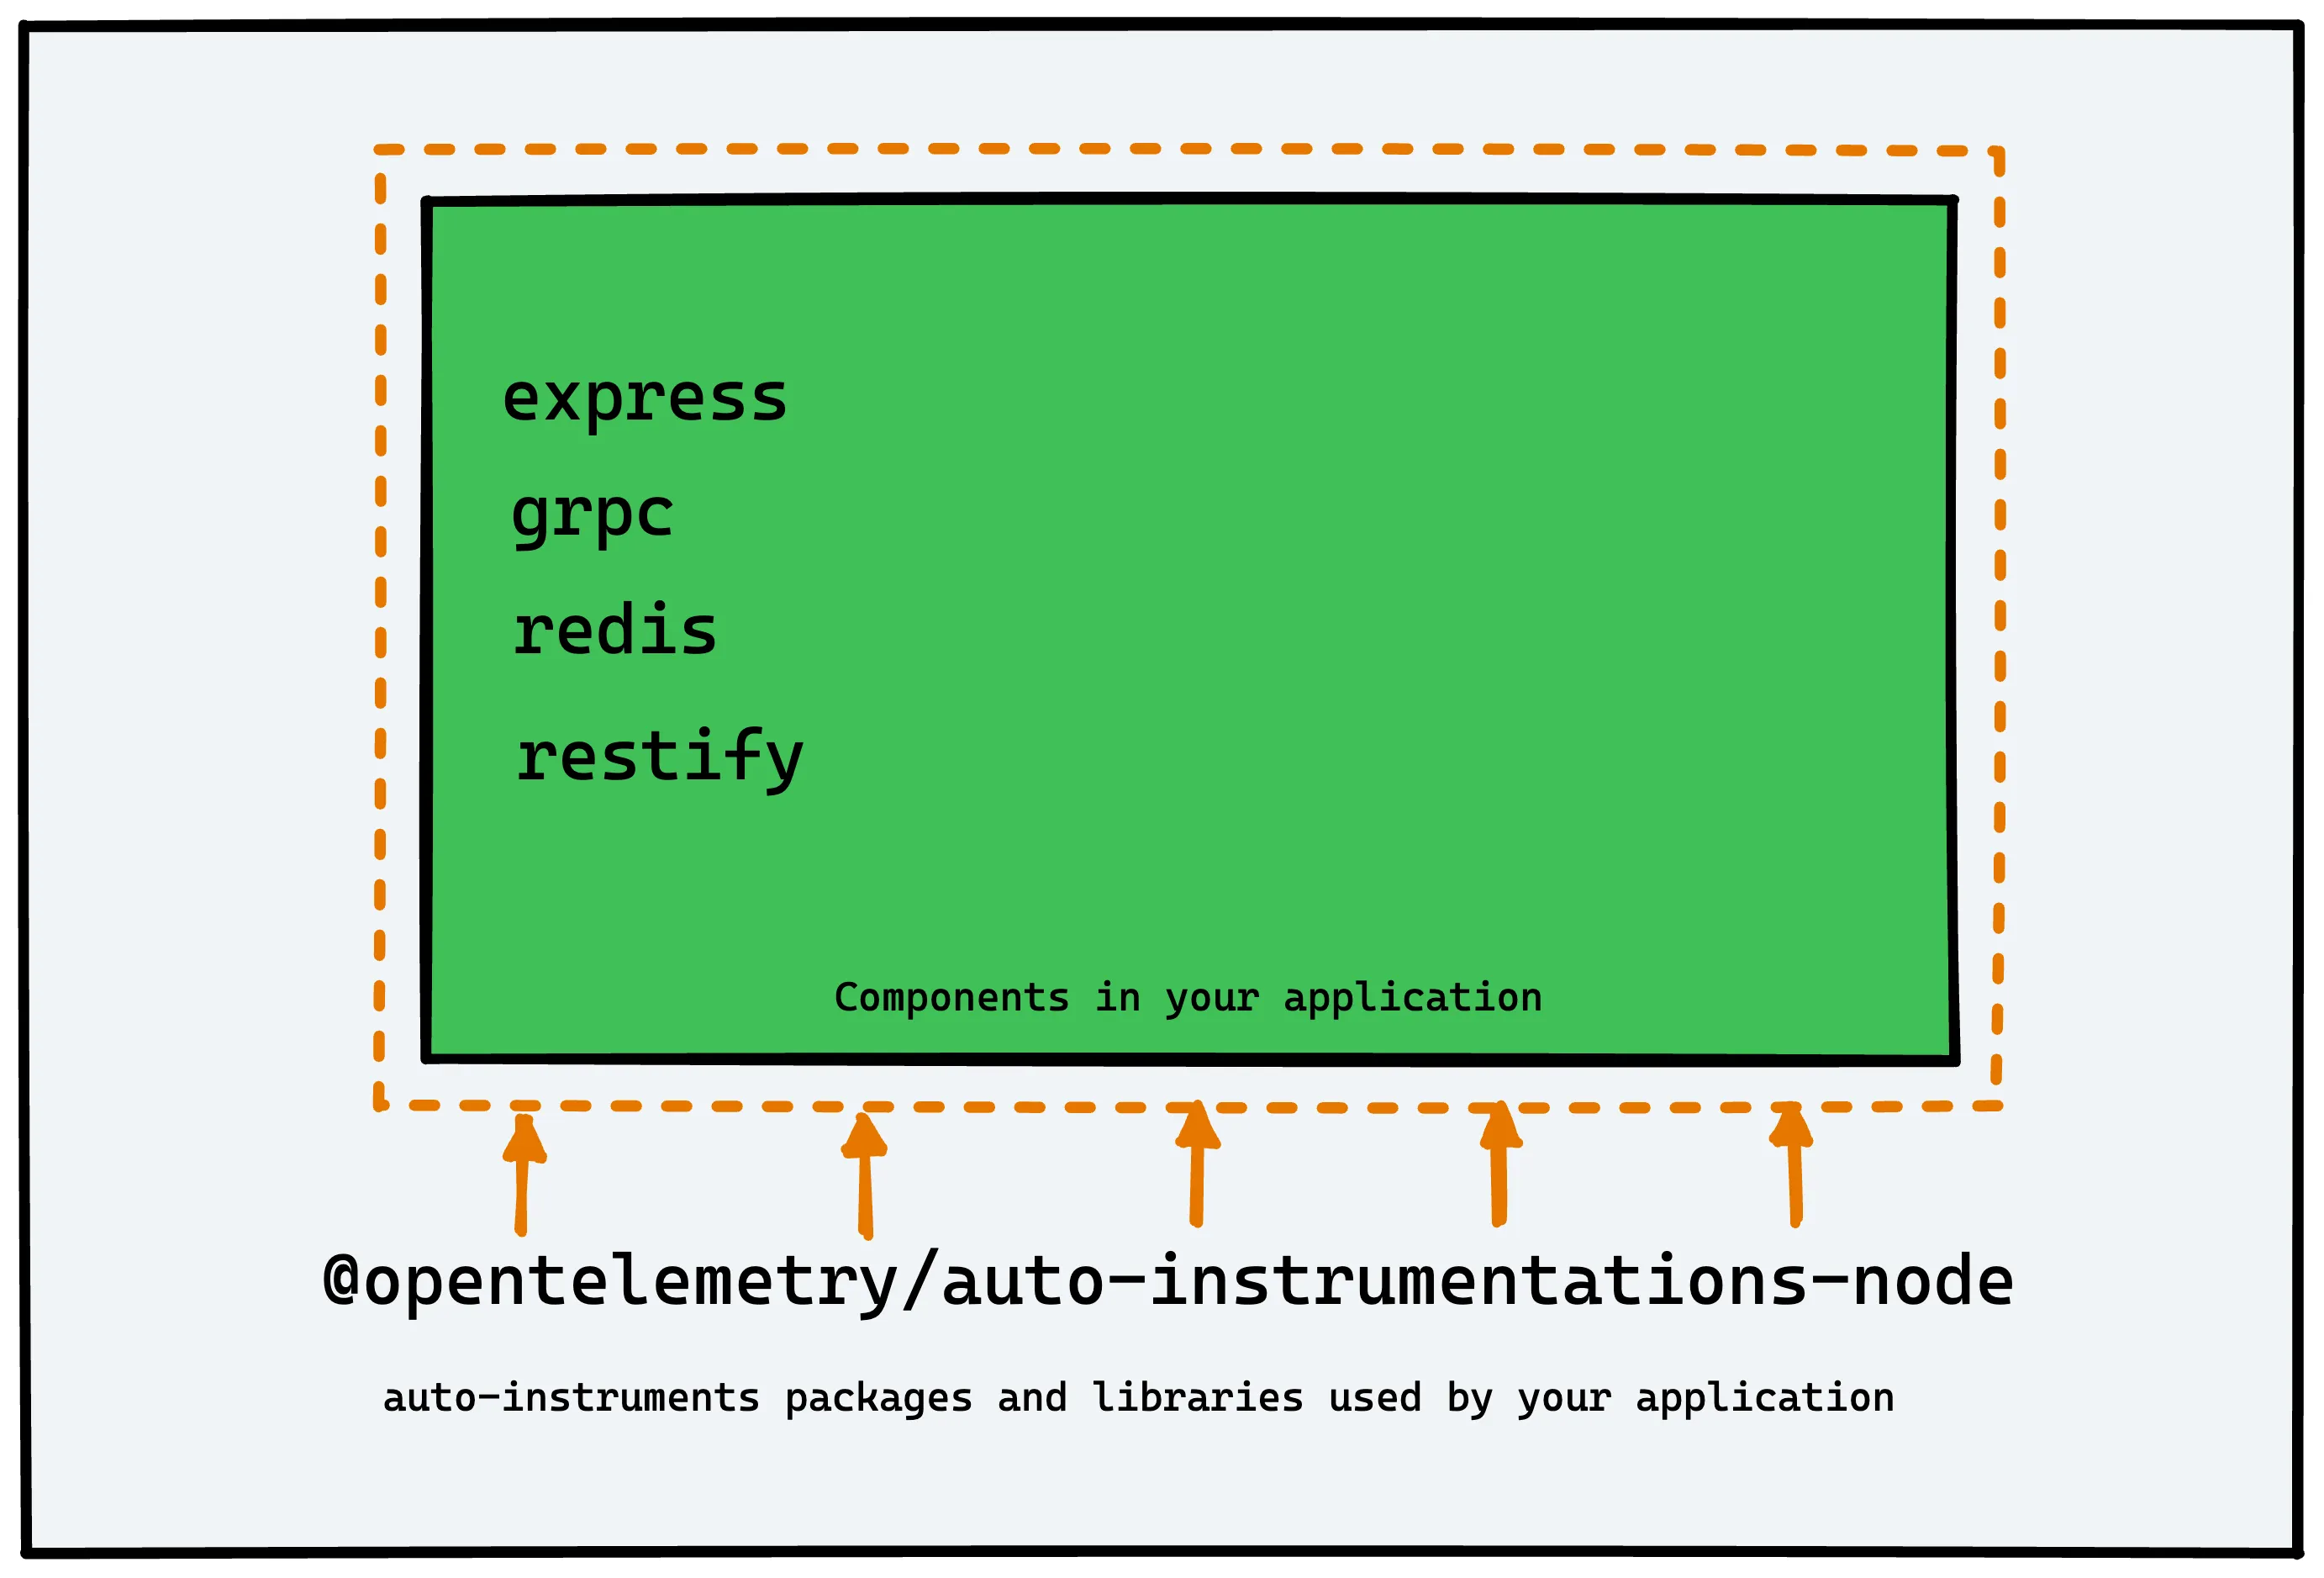
The auto-instrumentation library of OpenTelemetry is a meta package that provides a simple way to initialize multiple Nodejs instrumnetations.
If you are on K8s, you should checkout opentelemetry operators which enable auto instrumenting Javascript applications very easily.
- Use a specific auto-instrumentation library
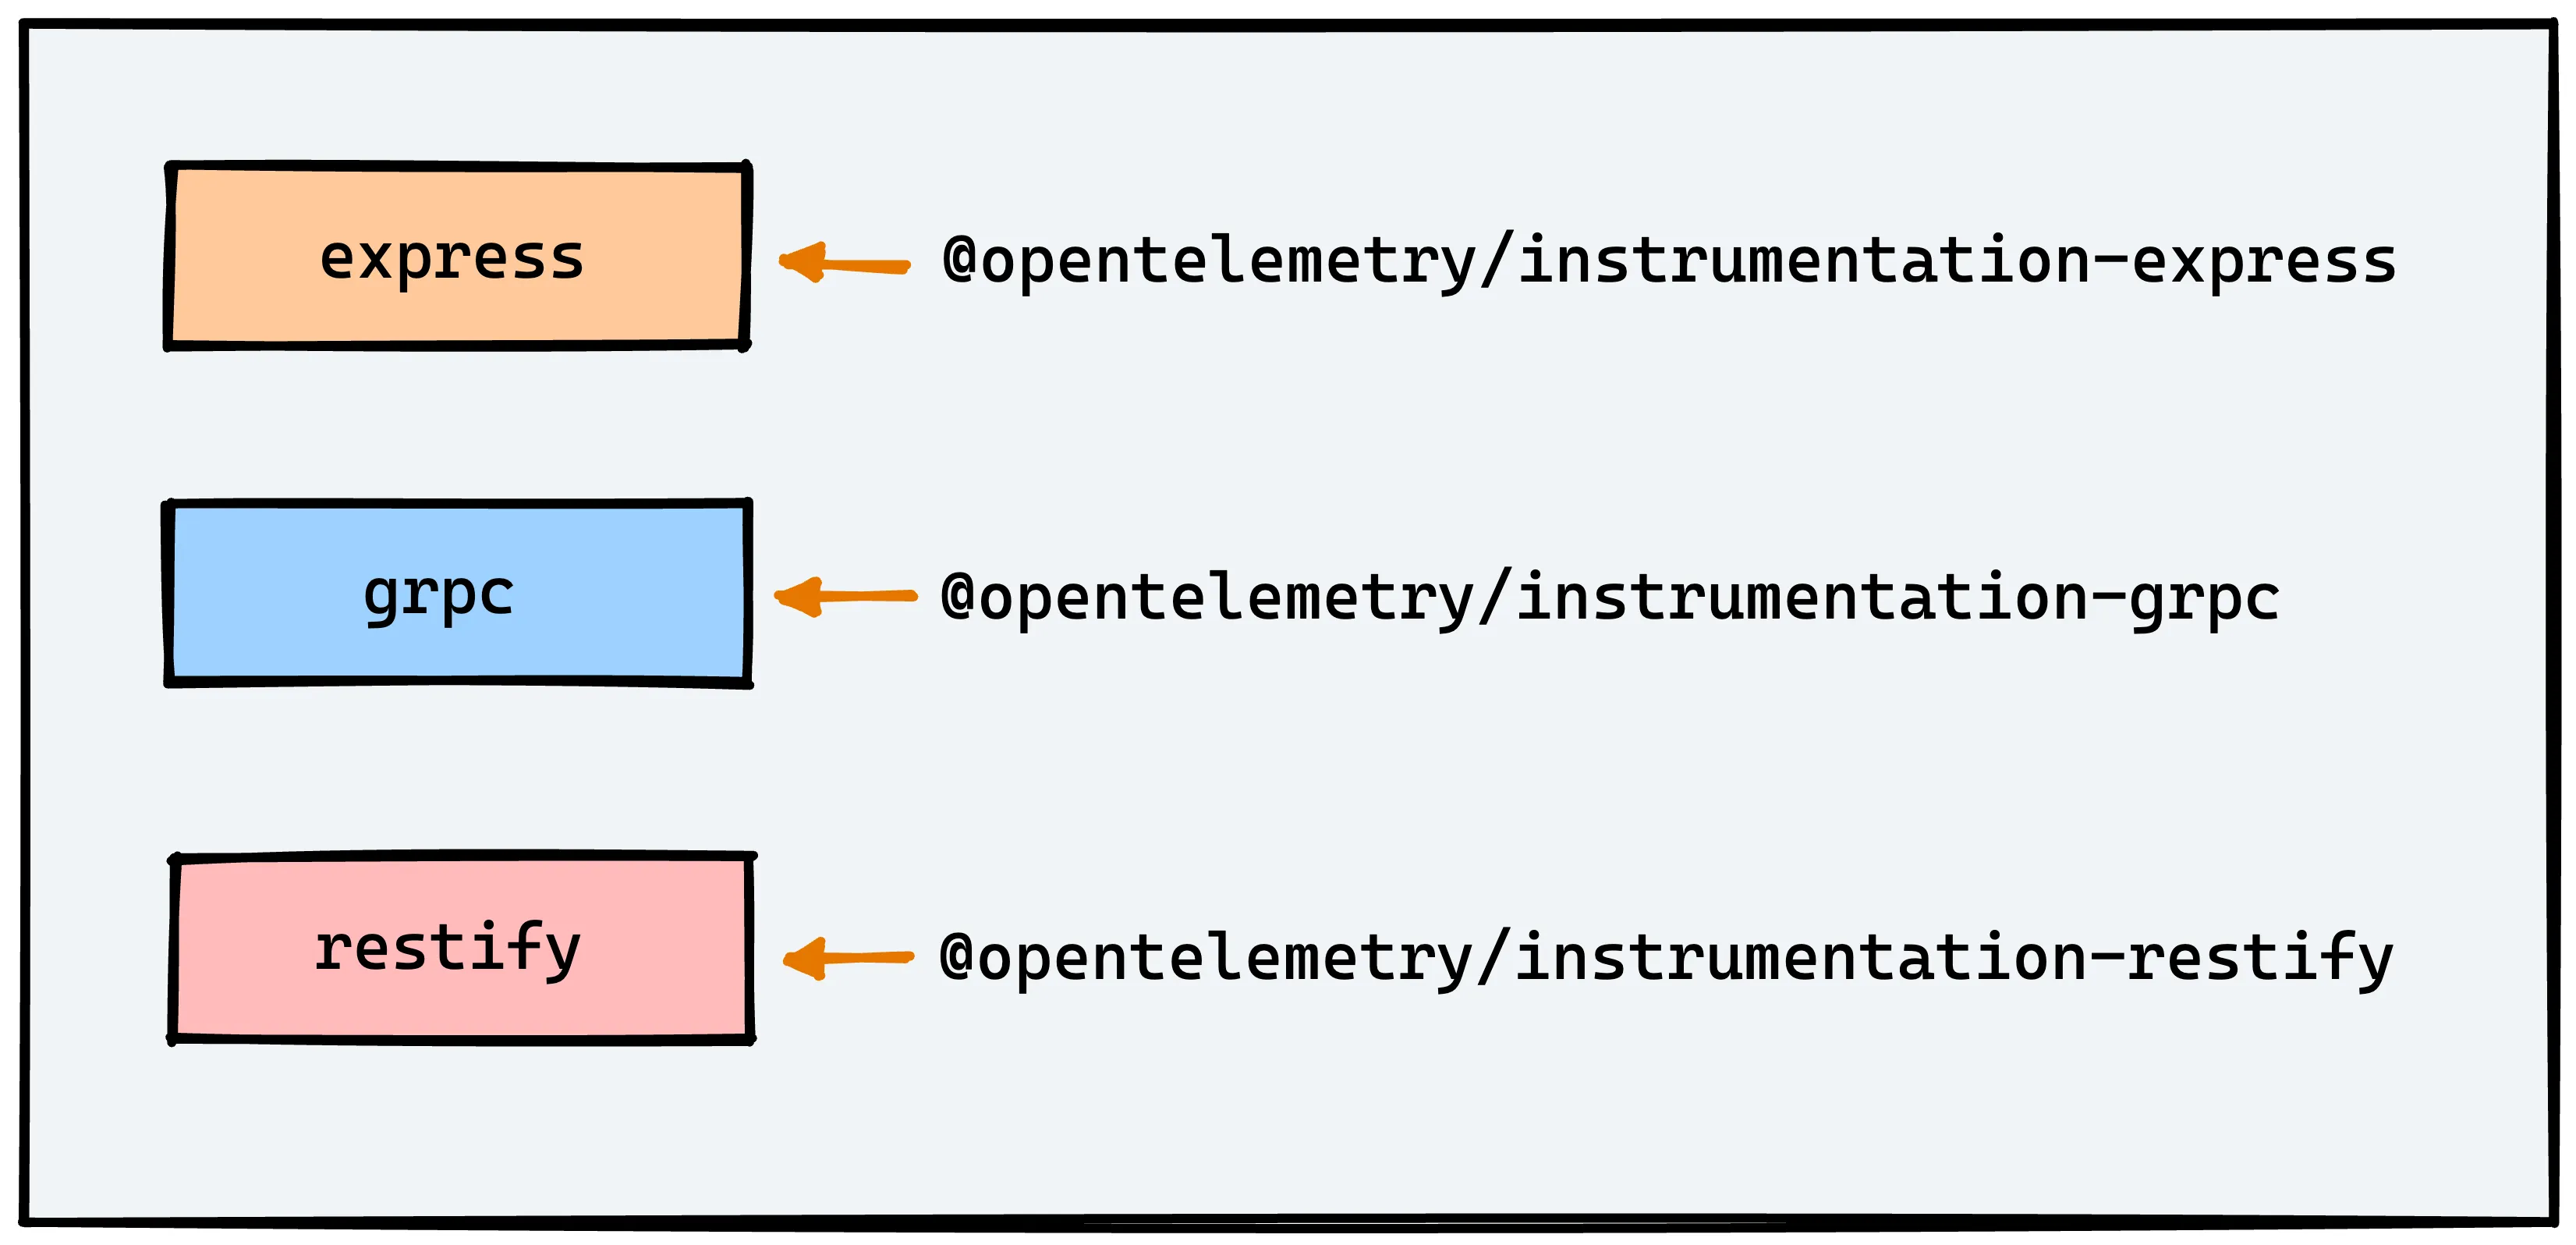
You can use individual auto-instrumentation libraries too for a specific component of your application. For example, you can use@opentelemetry/instrumentation-expressfor instrumenting the Express web framework.
Using the all-in-one auto-instrumentation library
The recommended way to instrument your Javascript Nodejs application is to use the all-in-one auto-instrumentation library - @opentelemetry/auto-instrumentations-node. It provides a simple way to initialize multiple Nodejs instrumentations.
Internally, it calls the specific auto-instrumentation library for components used in the application. You can see the complete list here.
The instrumentation automatically identifies the following within your application:
- Frameworks, such as Express, Nestjs
- Common protocols such as HTTP, HTTPS, and gRPC
- Databases, such as MySQL, MongoDB, Redis, etc.
- Other libraries used in the application

Steps to auto-instrument Nodejs application
Install the dependencies
We start by installing the relevant dependencies.npm install --save @opentelemetry/sdk-node
npm install --save @opentelemetry/auto-instrumentations-node
npm install --save @opentelemetry/exporter-trace-otlp-httpThe dependencies included are briefly explained below:
@opentelemetry/sdk-node- This package provides the full OpenTelemetry SDK for Node.js including tracing and metrics.@opentelemetry/auto-instrumentations-node- This module provides a simple way to initialize multiple Node instrumentations.@opentelemetry/exporter-trace-otlp-http- This module provides the exporter to be used with OTLP (http/json) compatible receivers.noteIf you run into any error, you might want to use these pinned versions of OpenTelemetry libraries used in this GitHub repo.
Create a
tracing.jsfile
Thetracing.jsfile will contain the tracing setup code. Notice, that we have set some environment variables in the code(highlighted). You can update these variables based on your environment.// tracing.js
'use strict'
const process = require('process');
const opentelemetry = require('@opentelemetry/sdk-node');
const { getNodeAutoInstrumentations } = require('@opentelemetry/auto-instrumentations-node');
const { OTLPTraceExporter } = require('@opentelemetry/exporter-trace-otlp-http');
const { Resource } = require('@opentelemetry/resources');
const { SemanticResourceAttributes } = require('@opentelemetry/semantic-conventions');
const exporterOptions = {
url: 'http://localhost:4318/v1/traces'
}
const traceExporter = new OTLPTraceExporter(exporterOptions);
const sdk = new opentelemetry.NodeSDK({
traceExporter,
instrumentations: [getNodeAutoInstrumentations()],
resource: new Resource({
[SemanticResourceAttributes.SERVICE_NAME]: 'node_app'
})
});
// initialize the SDK and register with the OpenTelemetry API
// this enables the API to record telemetry
sdk.start()
// gracefully shut down the SDK on process exit
process.on('SIGTERM', () => {
sdk.shutdown()
.then(() => console.log('Tracing terminated'))
.catch((error) => console.log('Error terminating tracing', error))
.finally(() => process.exit(0));
});OpenTelemetry Node SDK currently does not detect the
OTEL_RESOURCE_ATTRIBUTESfrom.envfiles as of today. That’s why we need to include the variables in thetracing.jsfile itself.About environment variables:
service_name: node_app (you can give whatever name that suits you)http://localhost:4318/v1/tracesis the default url for sending your tracing data. We are assuming you have installed SigNoz on yourlocalhost. Based on your environment, you can update it accordingly. It should be in the following format:http://<IP of SigNoz backend>:4318/v1/tracesnoteRemember to allow incoming requests to port 4318 of machine where SigNoz backend is hosted.
Run the application
The tracing configuration should be run before your application code. We will use the-r, —require moduleflag for that.node -r ./tracing.js app.jsnoteIf you're running your nodejs application in PM2 cluster mode, it doesn't support node args: Unitech/pm2#3227. As above sample app instrumentation requires to load
tracing.jsbefore app load by passing node arg, so nodejs instrumentation doesn't work in PM2 cluster mode. So you need to importtracing.jsin your main application. Theimport ./tracing.jsshould be the first line of your application code and initialize it before any other function. Here's the sample github repo which shows the implementation.In case you encounter an issue where all applications do not get listed in the services section then please refer to the troubleshooting section.
Validating instrumentation by checking for traces
With your application running, you can verify that you’ve instrumented your application with OpenTelemetry correctly by confirming that tracing data is being reported to SigNoz.
To do this, you need to ensure that your application generates some data. Applications will not produce traces unless they are being interacted with, and OpenTelemetry will often buffer data before sending. So you need to interact with your application and wait for some time to see your tracing data in SigNoz.
Validate your traces in SigNoz:
- Trigger an action in your app that generates a web request. Hit the endpoint a number of times to generate some data. Then, wait for some time.
- In SigNoz, open the
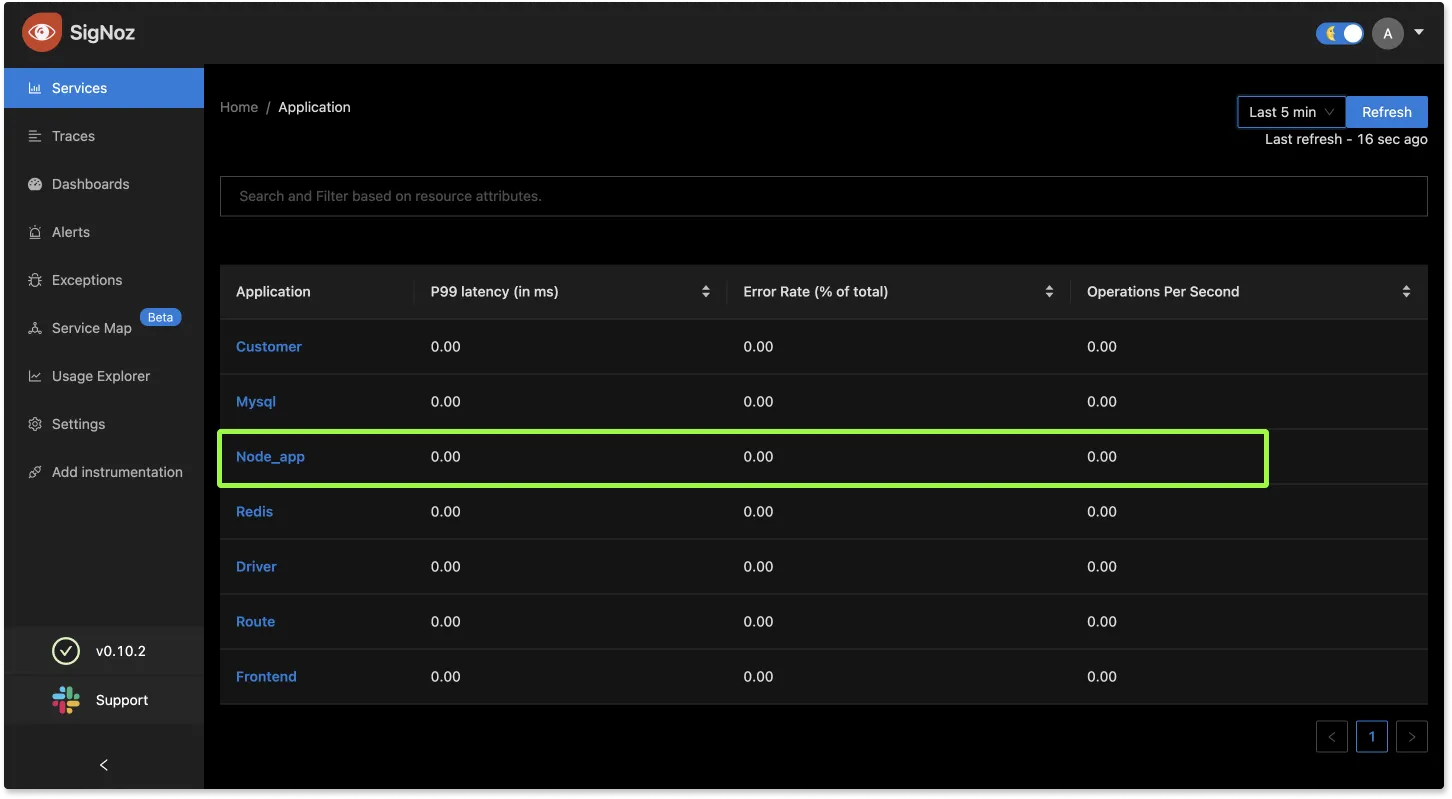
Servicestab. Hit theRefreshbutton on the top right corner, and your application should appear in the list ofApplications. - Go to the
Tracestab, and apply relevant filters to see your application’s traces.
You might see other dummy applications if you’re using SigNoz for the first time. You can remove it by following the docs here.

If you don't see your application reported in the list of services, try our troubleshooting guide.
Using a specific auto-instrumentation library
If total installation size is not constrained, it is recommended to use the @opentelemetry/auto-instrumentations-node bundle with @opentelemetry/sdk-node for the most seamless instrumentation experience.
But you can also install specific auto-instrumenation packages for the components used by your application.

If an application uses Express, HTTP, and MongoDB, we can instrument the application using the following modules:
- opentelemetry-instrumentation-express
- opentelemetry/instrumentation-mongodb
- opentelemetry/instrumentation-http
If you are using Express, the instrumentation relies on HTTP calls to also be instrumented. That’s why we’re also including the module for http instrumentation. Let’s see the steps required.
Steps to use specific auto-instrumentation libraries
Install the dependencies
We start by installing the relevant dependencies.npm install --save @opentelemetry/sdk-node
npm install --save @opentelemetry/exporter-trace-otlp-http
npm install --save @opentelemetry/instrumentation-express
npm install --save @opentelemetry/instrumentation-mongodb
npm install --save @opentelemetry/instrumentation-httpCreat a
tracing.jsfile
Thetracing.jsfile will contain the following tracing setup code.// tracing.js
'use strict'
const process = require('process');
//OpenTelemetry
const opentelemetry = require('@opentelemetry/sdk-node');
const { OTLPTraceExporter } = require('@opentelemetry/exporter-trace-otlp-http');
//instrumentations
const { ExpressInstrumentation } = require("@opentelemetry/instrumentation-express");
const { MongoDBInstrumentation } = require("@opentelemetry/instrumentation-mongodb");
const { HttpInstrumentation } = require("@opentelemetry/instrumentation-http");
const { Resource } = require('@opentelemetry/resources');
const { SemanticResourceAttributes } = require('@opentelemetry/semantic-conventions');
const exporterOptions = {
url: 'http://localhost:4318/v1/traces'
}
const traceExporter = new OTLPTraceExporter(exporterOptions);
const sdk = new opentelemetry.NodeSDK({
traceExporter,
instrumentations: [new ExpressInstrumentation(), new MongoDBInstrumentation(), new HttpInstrumentation()],
resource: new Resource({
[SemanticResourceAttributes.SERVICE_NAME]: 'node_app'
})
});
// initialize the SDK and register with the OpenTelemetry API
// this enables the API to record telemetry
sdk.start()
// gracefully shut down the SDK on process exit
process.on('SIGTERM', () => {
sdk.shutdown()
.then(() => console.log('Tracing terminated'))
.catch((error) => console.log('Error terminating tracing', error))
.finally(() => process.exit(0));
});OpenTelemetry Node SDK currently does not detect the
OTEL_RESOURCE_ATTRIBUTESfrom.envfiles as of today. That’s why we need to include the variables in thetracing.jsfile itself.About environment variables:
service_name: node_app (you can give whatever name that suits you)http://localhost:4318/v1/tracesis the default url for sending your tracing data. We are assuming you have installed SigNoz on yourlocalhost. Based on your environment, you can update it accordingly. It should be in the following format:http://<IP of SigNoz backend>:4318/v1/tracesnoteRemember to allow incoming requests to port 4318 of machine where SigNoz backend is hosted.
Run the application
The tracing configuration should be run before your application code. We will use the-r, —require moduleflag for that.node -r ./tracing.js app.jsnoteIf you're running your nodejs application in PM2 cluster mode, it doesn't support node args: Unitech/pm2#3227. As above sample app instrumentation requires to load
tracing.jsbefore app load by passing node arg, so nodejs instrumentation doesn't work in PM2 cluster mode. So you need to importtracing.jsin your main application. Theimport ./tracing.jsshould be the first line of your application code and initialize it before any other function. Here's the sample github repo which shows the implementation.
With your application running, you can verify that you’ve instrumented your application with OpenTelemetry correctly by validating if your traces are being to SigNoz.
Instrumentation Modules for Databases
The @opentelemetry/auto-instrumentations-node can inititialize instrumentation for popular databases. Hence it’s recommended to get started with it.
But if you are using specific auto-instrumentation packages, here’s a list of packages for popular databases.
MongoDB instrumentation
Note if you’re using @opentelemetry/auto-instrumentations-node, you don’t need to install specific modules for your database.
Supported Versions
• >=3.3 <5
Module that provides automatic instrumentation for MongoDB:
npm install --save @opentelemetry/instrumentation-mongodb
Redis Instrumentation
Note if you’re using @opentelemetry/auto-instrumentations-node, you don’t need to install specific modules for your database.
Supported Versions
This package supports redis@^2.6.0 and redis@^3.0.0
For version redis@^4.0.0, please use @opentelemetry/instrumentation-redis-4
npm install --save @opentelemetry/instrumentation-redis
MySQL Instrumentation
Note if you’re using @opentelemetry/auto-instrumentations-node, you don’t need to install specific modules for your database.
Supported Versions
• 2.x
Module that provides automatic instrumentation for MySQL:
npm install --save @opentelemetry/instrumentation-mysql
Memcached Instrumentation
Note if you’re using @opentelemetry/auto-instrumentations-node, you don’t need to install specific modules for your database.
Supported Versions
>=2.2
Module that provides automatic instrumentation for Memcached:
npm install --save @opentelemetry/instrumentation-memcached
Troubleshooting your installation
Set an environment variable to run the OpenTelemetry launcher in debug mode, where it logs details about the configuration and emitted spans:
export OTEL_LOG_LEVEL=debug
The output may be very verbose with some benign errors. Early in the console output, look for logs about the configuration. Next, look for lines like the ones below, which are emitted when spans are emitted to SigNoz.
{
  "traceId": "985b66d592a1299f7d12ebca56ca1fe3",
  "parentId": "8d62a70aa335a227",
  "name": "bar",
  "id": "17ada85c3d55376a",
  "kind": 0,
  "timestamp": 1685674607399000,
  "duration": 299,
  "attributes": {},
  "status": { "code": 0 },
  "events": []
}
{
  "traceId": "985b66d592a1299f7d12ebca56ca1fe3",
  "name": "foo",
  "id": "8d62a70aa335a227",
  "kind": 0,
  "timestamp": 1585130342183948,
  "duration": 315,
  "attributes": {
    "name": "value"
  },
  "status": { "code": 0 },
  "events": [
    {
      "name": "event in foo",
      "time": [1585130342, 184213041]
    }
  ]
}
Running short applications (Lambda/Serverless/etc) If your application exits quickly after startup, you may need to explicitly shutdown the tracer to ensure that all spans are flushed:
opentelemetry.trace.getTracer('your_tracer_name').getActiveSpanProcessor().shutdown()
Sample Javascript App
- We have included a sample applications at:
Further Reading
Frequently Asked Questions
How to find what to use in
IP of SigNozif I have installed SigNoz in Kubernetes cluster?Based on where you have installed your application and where you have installed SigNoz, you need to find the right value for this. Please use this grid to find the value you should use for
IP of SigNozI am sending data from my application to SigNoz, but I don't see any events or graphs in the SigNoz dashboard. What should I do?
This could be because of one of the following reasons:
Your application is generating telemetry data, but not able to connect with SigNoz installation
Please use this troubleshooting guide to find if your application is able to access SigNoz installation and send data to it.
Your application is not actually generating telemetry data
Please check if the application is generating telemetry data first. You can use
Console Exporterto just print your telemetry data in console first. Join our Slack Community if you need help on how to export your telemetry data in consoleYour SigNoz installation is not running or behind a firewall
Please double check if the pods in SigNoz installation are running fine.
docker psorkubectl get pods -n platformare your friends for this.