Go OpenTelemetry Instrumentation
This document contains instructions on how to set up OpenTelemetry instrumentation in your Go applications. OpenTelemetry, also known as OTel for short, is an open source observability framework that can help you generate and collect telemetry data - traces, metrics, and logs from your Go application.
Send Traces to SigNoz Cloud
- VM
- Kubernetes
From VMs, there are two ways to send data to SigNoz Cloud.
Send traces directly to SigNoz Cloud
Install Dependencies
Dependencies related to OpenTelemetry exporter and SDK have to be installed first. Note that we are assuming you are usingginrequest router. If you are using other request routers, check out the corresponding package.Run the below commands after navigating to the application source folder:
go get go.opentelemetry.io/otel \
  go.opentelemetry.io/otel/trace \
  go.opentelemetry.io/otel/sdk \
  go.opentelemetry.io/contrib/instrumentation/github.com/gin-gonic/gin/otelgin \
  go.opentelemetry.io/otel/exporters/otlp/otlptrace \
  go.opentelemetry.io/otel/exporters/otlp/otlptrace/otlptracegrpc
Declare environment variables for configuring OpenTelemetry
Declare the following global variables inmain.gowhich we will use to configure OpenTelemetry:var (
serviceName = os.Getenv("SERVICE_NAME")
collectorURL = os.Getenv("OTEL_EXPORTER_OTLP_ENDPOINT")
insecure = os.Getenv("INSECURE_MODE")
)Instrument your Go application with OpenTelemetry
To configure your application to send data we will need a function to initialize OpenTelemetry. Add the following snippet of code in yourmain.gofile.
import (
    .....

    "google.golang.org/grpc/credentials"
    "github.com/gin-gonic/gin"
    "go.opentelemetry.io/otel"
    "go.opentelemetry.io/otel/attribute"
    "go.opentelemetry.io/otel/exporters/otlp/otlptrace"
    "go.opentelemetry.io/otel/exporters/otlp/otlptrace/otlptracegrpc"

    "go.opentelemetry.io/otel/sdk/resource"
    sdktrace "go.opentelemetry.io/otel/sdk/trace"
)

func initTracer() func(context.Context) error {

    var secureOption otlptracegrpc.Option

    if strings.ToLower(insecure) == "false" || insecure == "0" || strings.ToLower(insecure) == "f" {
        secureOption = otlptracegrpc.WithTLSCredentials(credentials.NewClientTLSFromCert(nil, ""))
    } else {
        secureOption = otlptracegrpc.WithInsecure()
    }

    exporter, err := otlptrace.New(
        context.Background(),
        otlptracegrpc.NewClient(
            secureOption,
            otlptracegrpc.WithEndpoint(collectorURL),
        ),
    )

    if err != nil {
        log.Fatalf("Failed to create exporter: %v", err)
    }
    resources, err := resource.New(
        context.Background(),
        resource.WithAttributes(
            attribute.String("service.name", serviceName),
            attribute.String("library.language", "go"),
        ),
    )
    if err != nil {
        log.Fatalf("Could not set resources: %v", err)
    }

    otel.SetTracerProvider(
        sdktrace.NewTracerProvider(
            sdktrace.WithSampler(sdktrace.AlwaysSample()),
            sdktrace.WithBatcher(exporter),
            sdktrace.WithResource(resources),
        ),
    )
    return exporter.Shutdown
}
Initialize the tracer in main.go
Modify the main function to initialise the tracer inmain.go. Initiate the tracer at the very beginning of our main function.func main() {
cleanup := initTracer()
defer cleanup(context.Background())
......
}Add the OpenTelemetry Gin middleware
Configure Gin to use the middleware by adding the following lines inmain.go.import (
....
"go.opentelemetry.io/contrib/instrumentation/github.com/gin-gonic/gin/otelgin"
)
func main() {
......
r := gin.Default()
r.Use(otelgin.Middleware(serviceName))
......
}Set environment variables and run your Go Gin application
The run command must have some environment variables to send data to SigNoz cloud. The run command:SERVICE_NAME=goApp INSECURE_MODE=false OTEL_EXPORTER_OTLP_HEADERS=signoz-access-token=<SIGNOZ-INGESTION-TOKEN> OTEL_EXPORTER_OTLP_ENDPOINT=ingest.{region}.signoz.cloud:443 go run main.goWe can replace the placeholders based on our environment.
SERVICE_NAME: goGinApp (you can name it whatever you want)OTEL_EXPORTER_OTLP_HEADERS:signoz-access-token=<SIGNOZ-INGESTION-TOKEN>. Update<SIGNOZ-INGESTION-TOKEN>with the ingestion token provided by SigNozOTEL_EXPORTER_OTLP_ENDPOINT: ingest.{region}.signoz.cloud:443. Depending on the choice of your region for SigNoz cloud, the ingest endpoint will vary according to this table.Region Endpoint US ingest.us.signoz.cloud:443 IN ingest.in.signoz.cloud:443 EU ingest.eu.signoz.cloud:443
Send traces via OTel Collector binary
OTel Collector binary helps to collect logs, hostmetrics, resource and infra attributes. It is recommended to install Otel Collector binary to collect and send traces to SigNoz cloud. You can correlate signals and have rich contextual data through this way.
You can find instructions to install OTel Collector binary here in your VM. Once you are done setting up your OTel Collector binary, you can follow the below steps for instrumenting your Golang application.
Install Dependencies
Dependencies related to OpenTelemetry exporter and SDK have to be installed first. Note that we are assuming you are usingginrequest router. If you are using other request routers, check out the corresponding package.Run the below commands after navigating to the application source folder:
go get go.opentelemetry.io/otel \
  go.opentelemetry.io/otel/trace \
  go.opentelemetry.io/otel/sdk \
  go.opentelemetry.io/contrib/instrumentation/github.com/gin-gonic/gin/otelgin \
  go.opentelemetry.io/otel/exporters/otlp/otlptrace \
  go.opentelemetry.io/otel/exporters/otlp/otlptrace/otlptracegrpc
Declare environment variables for configuring OpenTelemetry
Declare the following global variables inmain.gowhich we will use to configure OpenTelemetry:var (
serviceName = os.Getenv("SERVICE_NAME")
collectorURL = os.Getenv("OTEL_EXPORTER_OTLP_ENDPOINT")
insecure = os.Getenv("INSECURE_MODE")
)Instrument your Go application with OpenTelemetry
To configure your application to send data we will need a function to initialize OpenTelemetry. Add the following snippet of code in yourmain.gofile.
 import (
     .....

     "google.golang.org/grpc/credentials"
     "github.com/gin-gonic/gin"
     "go.opentelemetry.io/otel"
     "go.opentelemetry.io/otel/attribute"
     "go.opentelemetry.io/otel/exporters/otlp/otlptrace"
     "go.opentelemetry.io/otel/exporters/otlp/otlptrace/otlptracegrpc"

     "go.opentelemetry.io/otel/sdk/resource"
     sdktrace "go.opentelemetry.io/otel/sdk/trace"
 )

 func initTracer() func(context.Context) error {

     var secureOption otlptracegrpc.Option

     if strings.ToLower(insecure) == "false" || insecure == "0" || strings.ToLower(insecure) == "f" {
         secureOption = otlptracegrpc.WithTLSCredentials(credentials.NewClientTLSFromCert(nil, ""))
     } else {
         secureOption = otlptracegrpc.WithInsecure()
     }

     exporter, err := otlptrace.New(
         context.Background(),
         otlptracegrpc.NewClient(
             secureOption,
             otlptracegrpc.WithEndpoint(collectorURL),
         ),
     )

     if err != nil {
         log.Fatalf("Failed to create exporter: %v", err)
     }
     resources, err := resource.New(
         context.Background(),
         resource.WithAttributes(
             attribute.String("service.name", serviceName),
             attribute.String("library.language", "go"),
         ),
     )
     if err != nil {
         log.Fatalf("Could not set resources: %v", err)
     }

     otel.SetTracerProvider(
         sdktrace.NewTracerProvider(
             sdktrace.WithSampler(sdktrace.AlwaysSample()),
             sdktrace.WithBatcher(exporter),
             sdktrace.WithResource(resources),
         ),
     )
     return exporter.Shutdown
 }
Initialize the tracer in main.go
Modify the main function to initialise the tracer inmain.go. Initiate the tracer at the very beginning of our main function.func main() {
cleanup := initTracer()
defer cleanup(context.Background())
......
}Add the OpenTelemetry Gin middleware
Configure Gin to use the middleware by adding the following lines inmain.go.import (
....
"go.opentelemetry.io/contrib/instrumentation/github.com/gin-gonic/gin/otelgin"
)
func main() {
......
r := gin.Default()
r.Use(otelgin.Middleware(serviceName))
......
}Set environment variables and run your Go Gin application
The run command must have some environment variables to send data to SigNoz. The run command:SERVICE_NAME=goGinApp INSECURE_MODE=true OTEL_EXPORTER_OTLP_ENDPOINT=localhost:4317 go run main.goIf you want to update your
service_name, you can modify theSERVICE_NAMEvariable.
SERVICE_NAME: goGinApp (you can name it whatever you want)You can validate if your application is sending traces to SigNoz cloud by following the instructions here.
For Golang application deployed on Kubernetes, you need to install OTel Collector agent in your k8s infra to collect and send traces to SigNoz Cloud. You can find the instructions to install OTel Collector agent here.
Once you have set up OTel Collector agent, you can proceed with OpenTelemetry Golang instrumentation by following the below steps:
Install Dependencies
Dependencies related to OpenTelemetry exporter and SDK have to be installed first. Note that we are assuming you are usingginrequest router. If you are using other request routers, check out the corresponding package.Run the below commands after navigating to the application source folder:
go get go.opentelemetry.io/otel \
  go.opentelemetry.io/otel/trace \
  go.opentelemetry.io/otel/sdk \
  go.opentelemetry.io/contrib/instrumentation/github.com/gin-gonic/gin/otelgin \
  go.opentelemetry.io/otel/exporters/otlp/otlptrace \
  go.opentelemetry.io/otel/exporters/otlp/otlptrace/otlptracegrpc
Declare environment variables for configuring OpenTelemetry
Declare the following global variables inmain.gowhich we will use to configure OpenTelemetry:var (
serviceName = os.Getenv("SERVICE_NAME")
collectorURL = os.Getenv("OTEL_EXPORTER_OTLP_ENDPOINT")
insecure = os.Getenv("INSECURE_MODE")
)Instrument your Go application with OpenTelemetry
To configure your application to send data we will need a function to initialize OpenTelemetry. Add the following snippet of code in yourmain.gofile.
 import (
     .....

     "google.golang.org/grpc/credentials"
     "github.com/gin-gonic/gin"
     "go.opentelemetry.io/otel"
     "go.opentelemetry.io/otel/attribute"
     "go.opentelemetry.io/otel/exporters/otlp/otlptrace"
     "go.opentelemetry.io/otel/exporters/otlp/otlptrace/otlptracegrpc"

     "go.opentelemetry.io/otel/sdk/resource"
     sdktrace "go.opentelemetry.io/otel/sdk/trace"
 )

 func initTracer() func(context.Context) error {

     var secureOption otlptracegrpc.Option

     if strings.ToLower(insecure) == "false" || insecure == "0" || strings.ToLower(insecure) == "f" {
         secureOption = otlptracegrpc.WithTLSCredentials(credentials.NewClientTLSFromCert(nil, ""))
     } else {
         secureOption = otlptracegrpc.WithInsecure()
     }

     exporter, err := otlptrace.New(
         context.Background(),
         otlptracegrpc.NewClient(
             secureOption,
             otlptracegrpc.WithEndpoint(collectorURL),
         ),
     )

     if err != nil {
         log.Fatalf("Failed to create exporter: %v", err)
     }
     resources, err := resource.New(
         context.Background(),
         resource.WithAttributes(
             attribute.String("service.name", serviceName),
             attribute.String("library.language", "go"),
         ),
     )
     if err != nil {
         log.Fatalf("Could not set resources: %v", err)
     }

     otel.SetTracerProvider(
         sdktrace.NewTracerProvider(
             sdktrace.WithSampler(sdktrace.AlwaysSample()),
             sdktrace.WithBatcher(exporter),
             sdktrace.WithResource(resources),
         ),
     )
     return exporter.Shutdown
 }
Initialize the tracer in main.go
Modify the main function to initialise the tracer inmain.go. Initiate the tracer at the very beginning of our main function.func main() {
cleanup := initTracer()
defer cleanup(context.Background())
......
}Add the OpenTelemetry Gin middleware
Configure Gin to use the middleware by adding the following lines inmain.go.import (
....
"go.opentelemetry.io/contrib/instrumentation/github.com/gin-gonic/gin/otelgin"
)
func main() {
......
r := gin.Default()
r.Use(otelgin.Middleware(serviceName))
......
}Set environment variables and run your Go Gin application
The run command must have some environment variables to send data to SigNoz. The run command:SERVICE_NAME=goGinApp INSECURE_MODE=true OTEL_EXPORTER_OTLP_ENDPOINT=localhost:4317 go run main.goIf you want to update your
service_name, you can modify theSERVICE_NAMEvariable.
SERVICE_NAME: goGinApp (you can name it whatever you want)You can validate if your application is sending traces to SigNoz cloud by following the instructions here.
Send Traces to Self-Hosted SigNoz
Install Dependencies
Dependencies related to OpenTelemetry exporter and SDK have to be installed first. Note that we are assuming you are usingginrequest router. If you are using other request routers, check out the corresponding package.Run the below commands after navigating to the application source folder:
go get go.opentelemetry.io/otel \
  go.opentelemetry.io/otel/trace \
  go.opentelemetry.io/otel/sdk \
  go.opentelemetry.io/contrib/instrumentation/github.com/gin-gonic/gin/otelgin \
  go.opentelemetry.io/otel/exporters/otlp/otlptrace \
  go.opentelemetry.io/otel/exporters/otlp/otlptrace/otlptracegrpc
Declare environment variables for configuring OpenTelemetry
Declare the following global variables inmain.gowhich we will use to configure OpenTelemetry:var (
serviceName = os.Getenv("SERVICE_NAME")
collectorURL = os.Getenv("OTEL_EXPORTER_OTLP_ENDPOINT")
insecure = os.Getenv("INSECURE_MODE")
)Instrument your Go application with OpenTelemetry
To configure your application to send data we will need a function to initialize OpenTelemetry. Add the following snippet of code in yourmain.gofile.
 import (
     .....

     "google.golang.org/grpc/credentials"
     "github.com/gin-gonic/gin"
     "go.opentelemetry.io/otel"
     "go.opentelemetry.io/otel/attribute"
     "go.opentelemetry.io/otel/exporters/otlp/otlptrace"
     "go.opentelemetry.io/otel/exporters/otlp/otlptrace/otlptracegrpc"

     "go.opentelemetry.io/otel/sdk/resource"
     sdktrace "go.opentelemetry.io/otel/sdk/trace"
 )

 func initTracer() func(context.Context) error {

     var secureOption otlptracegrpc.Option

     if strings.ToLower(insecure) == "false" || insecure == "0" || strings.ToLower(insecure) == "f" {
         secureOption = otlptracegrpc.WithTLSCredentials(credentials.NewClientTLSFromCert(nil, ""))
     } else {
         secureOption = otlptracegrpc.WithInsecure()
     }

     exporter, err := otlptrace.New(
         context.Background(),
         otlptracegrpc.NewClient(
             secureOption,
             otlptracegrpc.WithEndpoint(collectorURL),
         ),
     )

     if err != nil {
         log.Fatalf("Failed to create exporter: %v", err)
     }
     resources, err := resource.New(
         context.Background(),
         resource.WithAttributes(
             attribute.String("service.name", serviceName),
             attribute.String("library.language", "go"),
         ),
     )
     if err != nil {
         log.Fatalf("Could not set resources: %v", err)
     }

     otel.SetTracerProvider(
         sdktrace.NewTracerProvider(
             sdktrace.WithSampler(sdktrace.AlwaysSample()),
             sdktrace.WithBatcher(exporter),
             sdktrace.WithResource(resources),
         ),
     )
     return exporter.Shutdown
 }
Initialize the tracer in main.go
Modify the main function to initialise the tracer inmain.go. Initiate the tracer at the very beginning of our main function.func main() {
cleanup := initTracer()
defer cleanup(context.Background())
......
}Add the OpenTelemetry Gin middleware
Configure Gin to use the middleware by adding the following lines inmain.go.import (
....
"go.opentelemetry.io/contrib/instrumentation/github.com/gin-gonic/gin/otelgin"
)
func main() {
......
r := gin.Default()
r.Use(otelgin.Middleware(serviceName))
......
}Set environment variables and run your Go Gin application
The run command must have some environment variables to send data to SigNoz. The run command:SERVICE_NAME=<service_name> INSECURE_MODE=true OTEL_EXPORTER_OTLP_ENDPOINT=<IP of SigNoz backend:4317> go run main.goWe can replace the placeholders based on our environment.
SERVICE_NAME: goGinApp (you can name it whatever you want)OTEL_EXPORTER_OTLP_ENDPOINT: localhost:4317Since, we have installed SigNoz on our local machine, we use the above IP. If you install SigNoz on a different machine, you can update it with the relevant IP.
Do not use
httporhttpsin the IP address. For example, if the IP ishttp://test.comthen theOTEL_EXPORTER_OTLP_ENDPOINTwill betest.com:4317.Here’s a handy grid to figure out which address to use to send data to SigNoz.
Hence, the final run command looks like this:
SERVICE_NAME=goGinApp INSECURE_MODE=true OTEL_EXPORTER_OTLP_ENDPOINT=localhost:4317 go run main.go
Validating instrumentation by checking for traces
With your application running, you can verify that you’ve instrumented your application with OpenTelemetry correctly by confirming that tracing data is being reported to SigNoz.
To do this, you need to ensure that your application generates some data. Applications will not produce traces unless they are being interacted with, and OpenTelemetry will often buffer data before sending. So you need to interact with your application and wait for some time to see your tracing data in SigNoz.
Validate your traces in SigNoz:
- Trigger an action in your app that generates a web request. Hit the endpoint a number of times to generate some data. Then, wait for some time.
- In SigNoz, open the
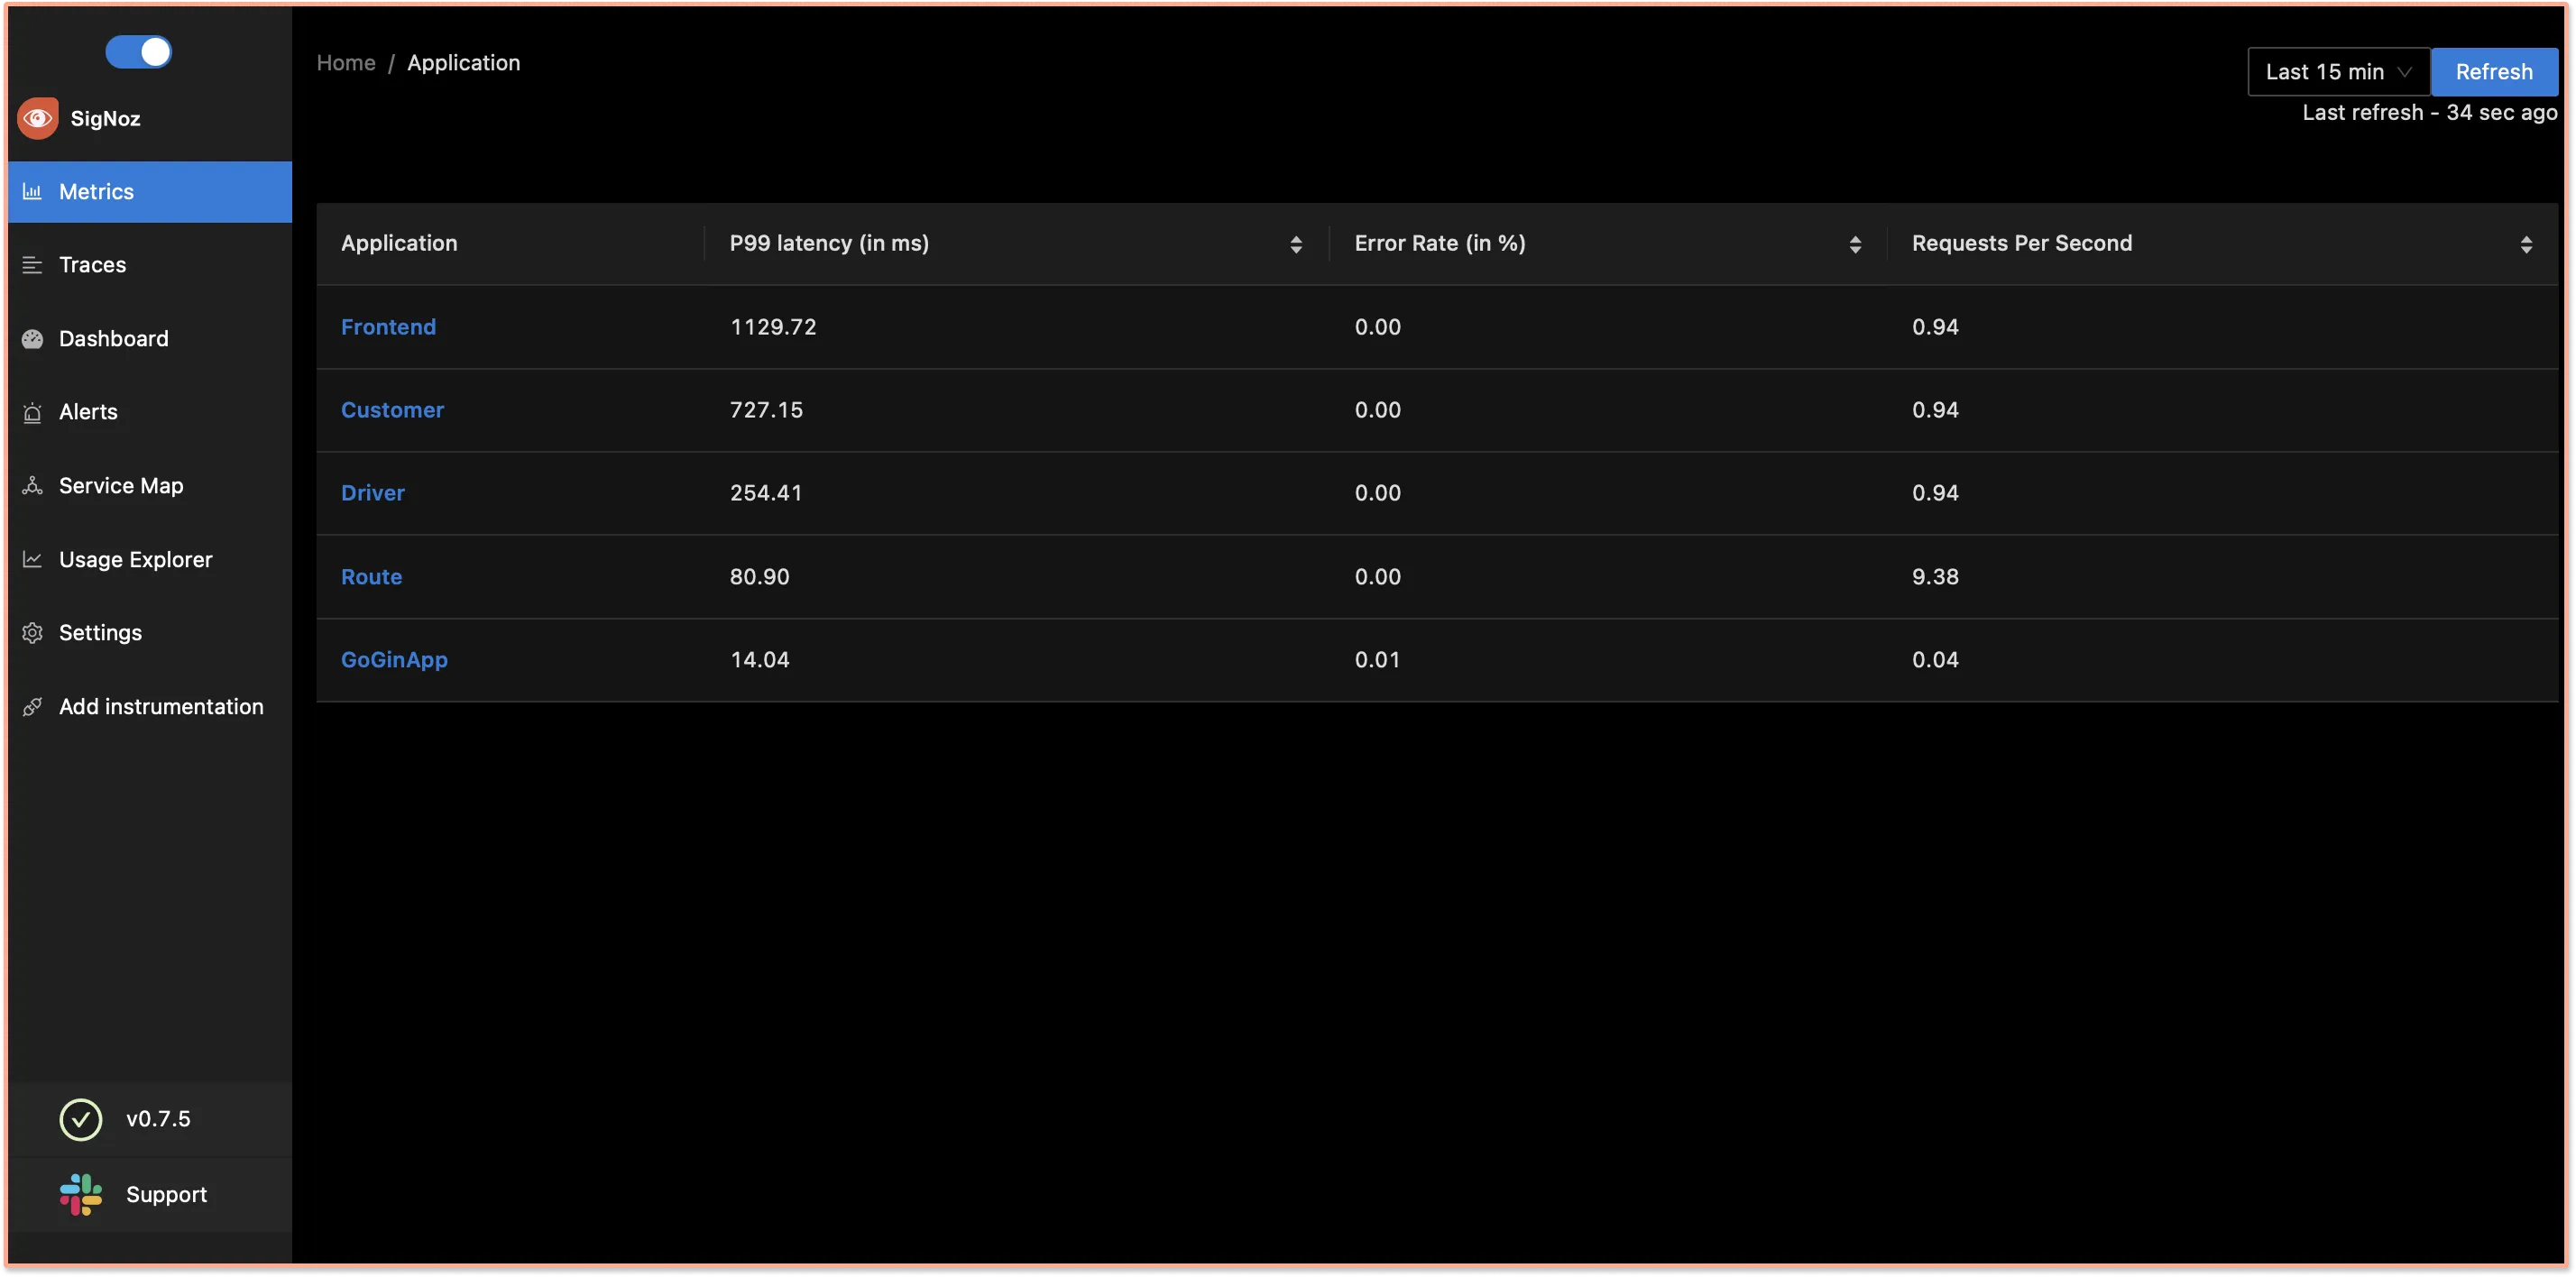
Servicestab. Hit theRefreshbutton on the top right corner, and your application should appear in the list ofApplications. - Go to the
Tracestab, and apply relevant filters to see your application’s traces.
You might see other dummy applications if you’re using SigNoz for the first time. You can remove it by following the docs here.

If you don't see your application reported in the list of services, try our troubleshooting guide.
Request Routers
OpenTelemetry gin/gonic instrumentation
# Add one line to your import() stanza depending upon your request router:
middleware "go.opentelemetry.io/contrib/instrumentation/github.com/gin-gonic/gin/otelgin"
and then inject OpenTelemetry middleware:
router.Use(middleware.Middleware(serviceName))
OpenTelemetry gorillamux instrumentation
# Add one line to your import() stanza depending upon your request router:
middleware "go.opentelemetry.io/contrib/instrumentation/github.com/gorilla/mux/otelmux"
and then inject OpenTelemetry middleware:
router.Use(middleware.Middleware(serviceName))
OpenTelemetry echo instrumentation
# Add one line to your import() stanza depending upon your request router:
middleware "go.opentelemetry.io/contrib/instrumentation/github.com/labstack/echo/otelecho"
and then inject OpenTelemetry middleware:
router.Use(middleware.Middleware(serviceName))
If you don’t use a request router
import (
  "go.opentelemetry.io/contrib/instrumentation/net/http/otelhttp"
)
In each place where you pass an http.Handler to a ServeMux, you’ll wrap the handler function. For instance, you’ll make the following replacements:
- mux.Handle("/path", h)
+ mux.Handle("/path", otelhttp.NewHandler(h, "description of path"))
- mux.Handle("/path", http.HandlerFunc(f))
+ mux.Handle("/path", otelhttp.NewHandler(http.HandlerFunc(f), "description of path"))
In this fashion, you can ensure that every function you wrap with othttp will automatically have its metadata collected and a corresponding trace started.
Adding custom attributes and custom events to spans
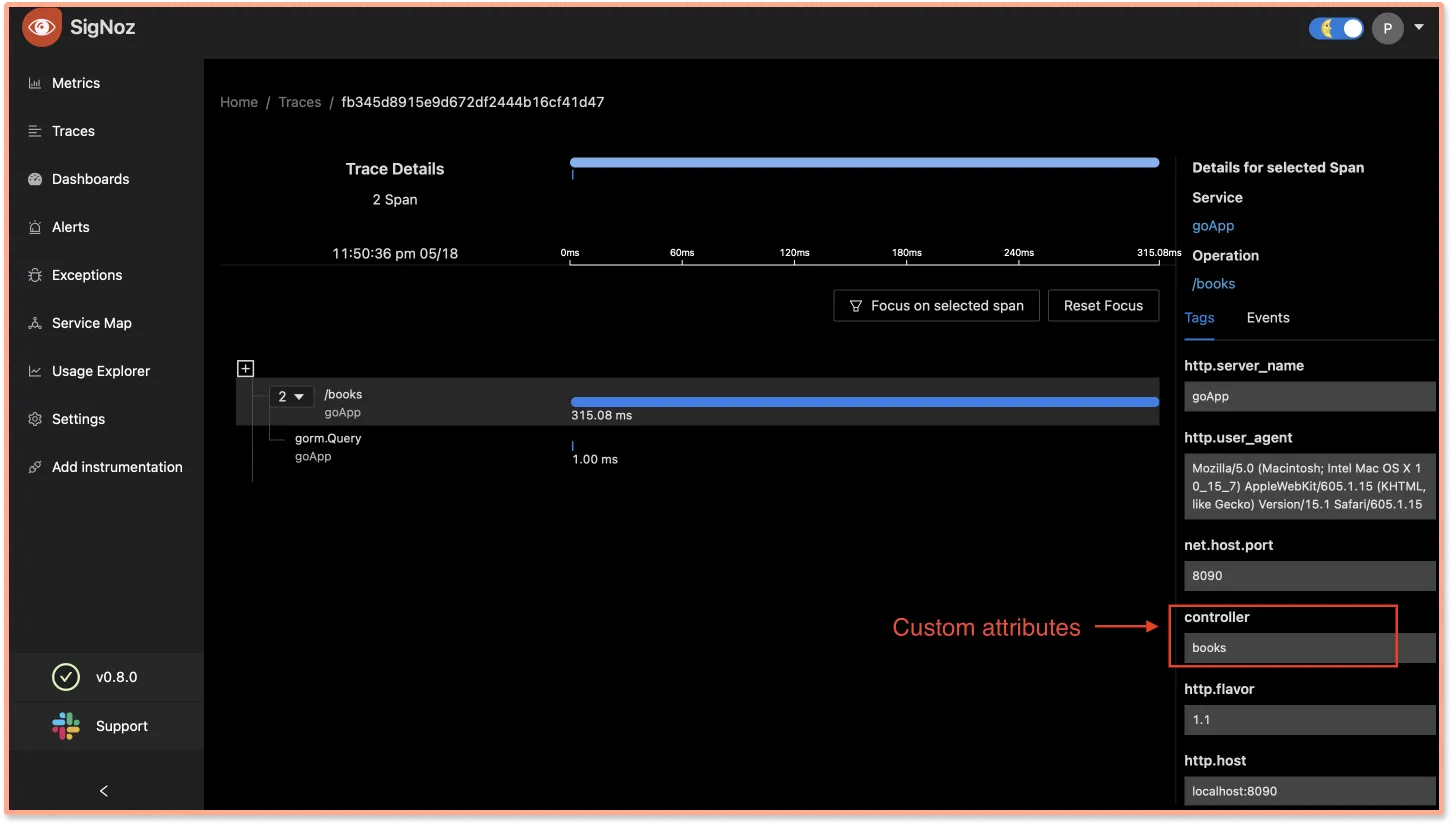
It’s also possible to set custom attributes or tags to a span. To add custom attributes and events follow the below steps:
Import trace and attribute libraries
import (
    ...
    "go.opentelemetry.io/otel/attribute"
    "go.opentelemetry.io/otel/trace"
)
Fetch current span from context
span := trace.SpanFromContext(c.Request.Context())Set attribute on current
span.SetAttributes(attribute.String("controller", "books"))
SigNoz dashboards can be used to track these custom attributes.

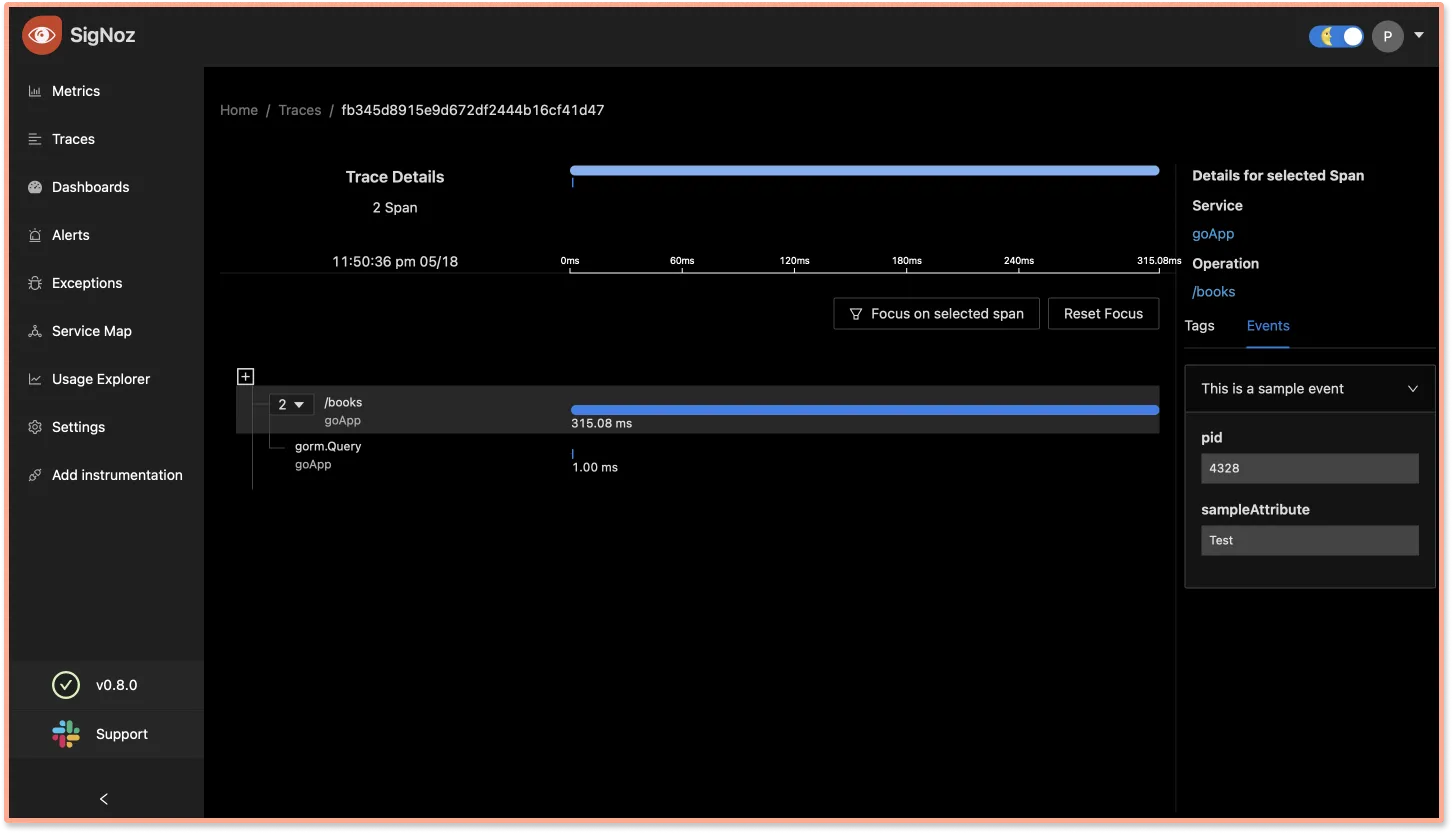
We can also set custom events on the span with its own attribute.
span.AddEvent("This is a sample event", trace.WithAttributes(attribute.Int("pid", 4328), attribute.String("sampleAttribute", "Test")))

gRPC Instrumentation with OpenTelemetry
Similarly, OpenTelemetry can also help you automatically instrument gRPC requests. To instrument any gRPC servers you have, add an Interceptor to the instantiation of the server.
import (
  grpcotel "go.opentelemetry.io/contrib/instrumentation/google.golang.org/grpc/otelgrpc"
)

func main() {
  [...]

    s := grpc.NewServer(
        grpc.UnaryInterceptor(grpcotel.UnaryServerInterceptor()),
        grpc.StreamInterceptor(grpcotel.StreamServerInterceptor()),
    )

}
We have a blog Monitor gRPC calls with OpenTelemetry - explained with a Golang example, do refer to that in case you need a helping hand to work with gRPC server.
Recording Errors and Exceptions
import "go.opentelemetry.io/otel/codes"

// Get the current span from the tracer
span := trace.SpanFromContext(ctx)

// RecordError converts an error into a span event.
span.RecordError(err)

// Mark span as failed.
span.SetStatus(codes.Error, "internal error")
Sample Golang application
We have included a sample gin/gonic application with README.md at https://github.com/SigNoz/sample-golang-app.
Feel free to use this repo to test out OpenTelemetry instrumentation and how to send telemetry data to SigNoz.
Library and framework support
Besides OpenTelemetry core modules, it is important to install instrumentation packages for every important library and framework which your service depends upon. Beyond the critical telemetry data these components emit, library and framework integrations are often required to ensure that the trace context is properly propagated.
OpenTelemetry automatically provides instrumentation for a large number of libraries and frameworks, right out of the box.
The full list of supported instrumentation can be found in the README.
You can also find libraries, plugins, integrations, and other useful tools for extending OpenTelemetry from the OpenTelemetry registry.
Frequently Asked Questions
How to find what to use in
IP of SigNozif I have installed SigNoz in Kubernetes cluster?Based on where you have installed your application and where you have installed SigNoz, you need to find the right value for this. Please use this grid to find the value you should use for
IP of SigNozI am sending data from my application to SigNoz, but I don't see any events or graphs in the SigNoz dashboard. What should I do?
This could be because of one of the following reasons:
Your application is generating telemetry data, but not able to connect with SigNoz installation
Please use this troubleshooting guide to find if your application is able to access SigNoz installation and send data to it.
Your application is not actually generating telemetry data
Please check if the application is generating telemetry data first. You can use
Console Exporterto just print your telemetry data in console first. Join our Slack Community if you need help on how to export your telemetry data in consoleYour SigNoz installation is not running or behind a firewall
Please double check if the pods in SigNoz installation are running fine.
docker psorkubectl get pods -n platformare your friends for this.