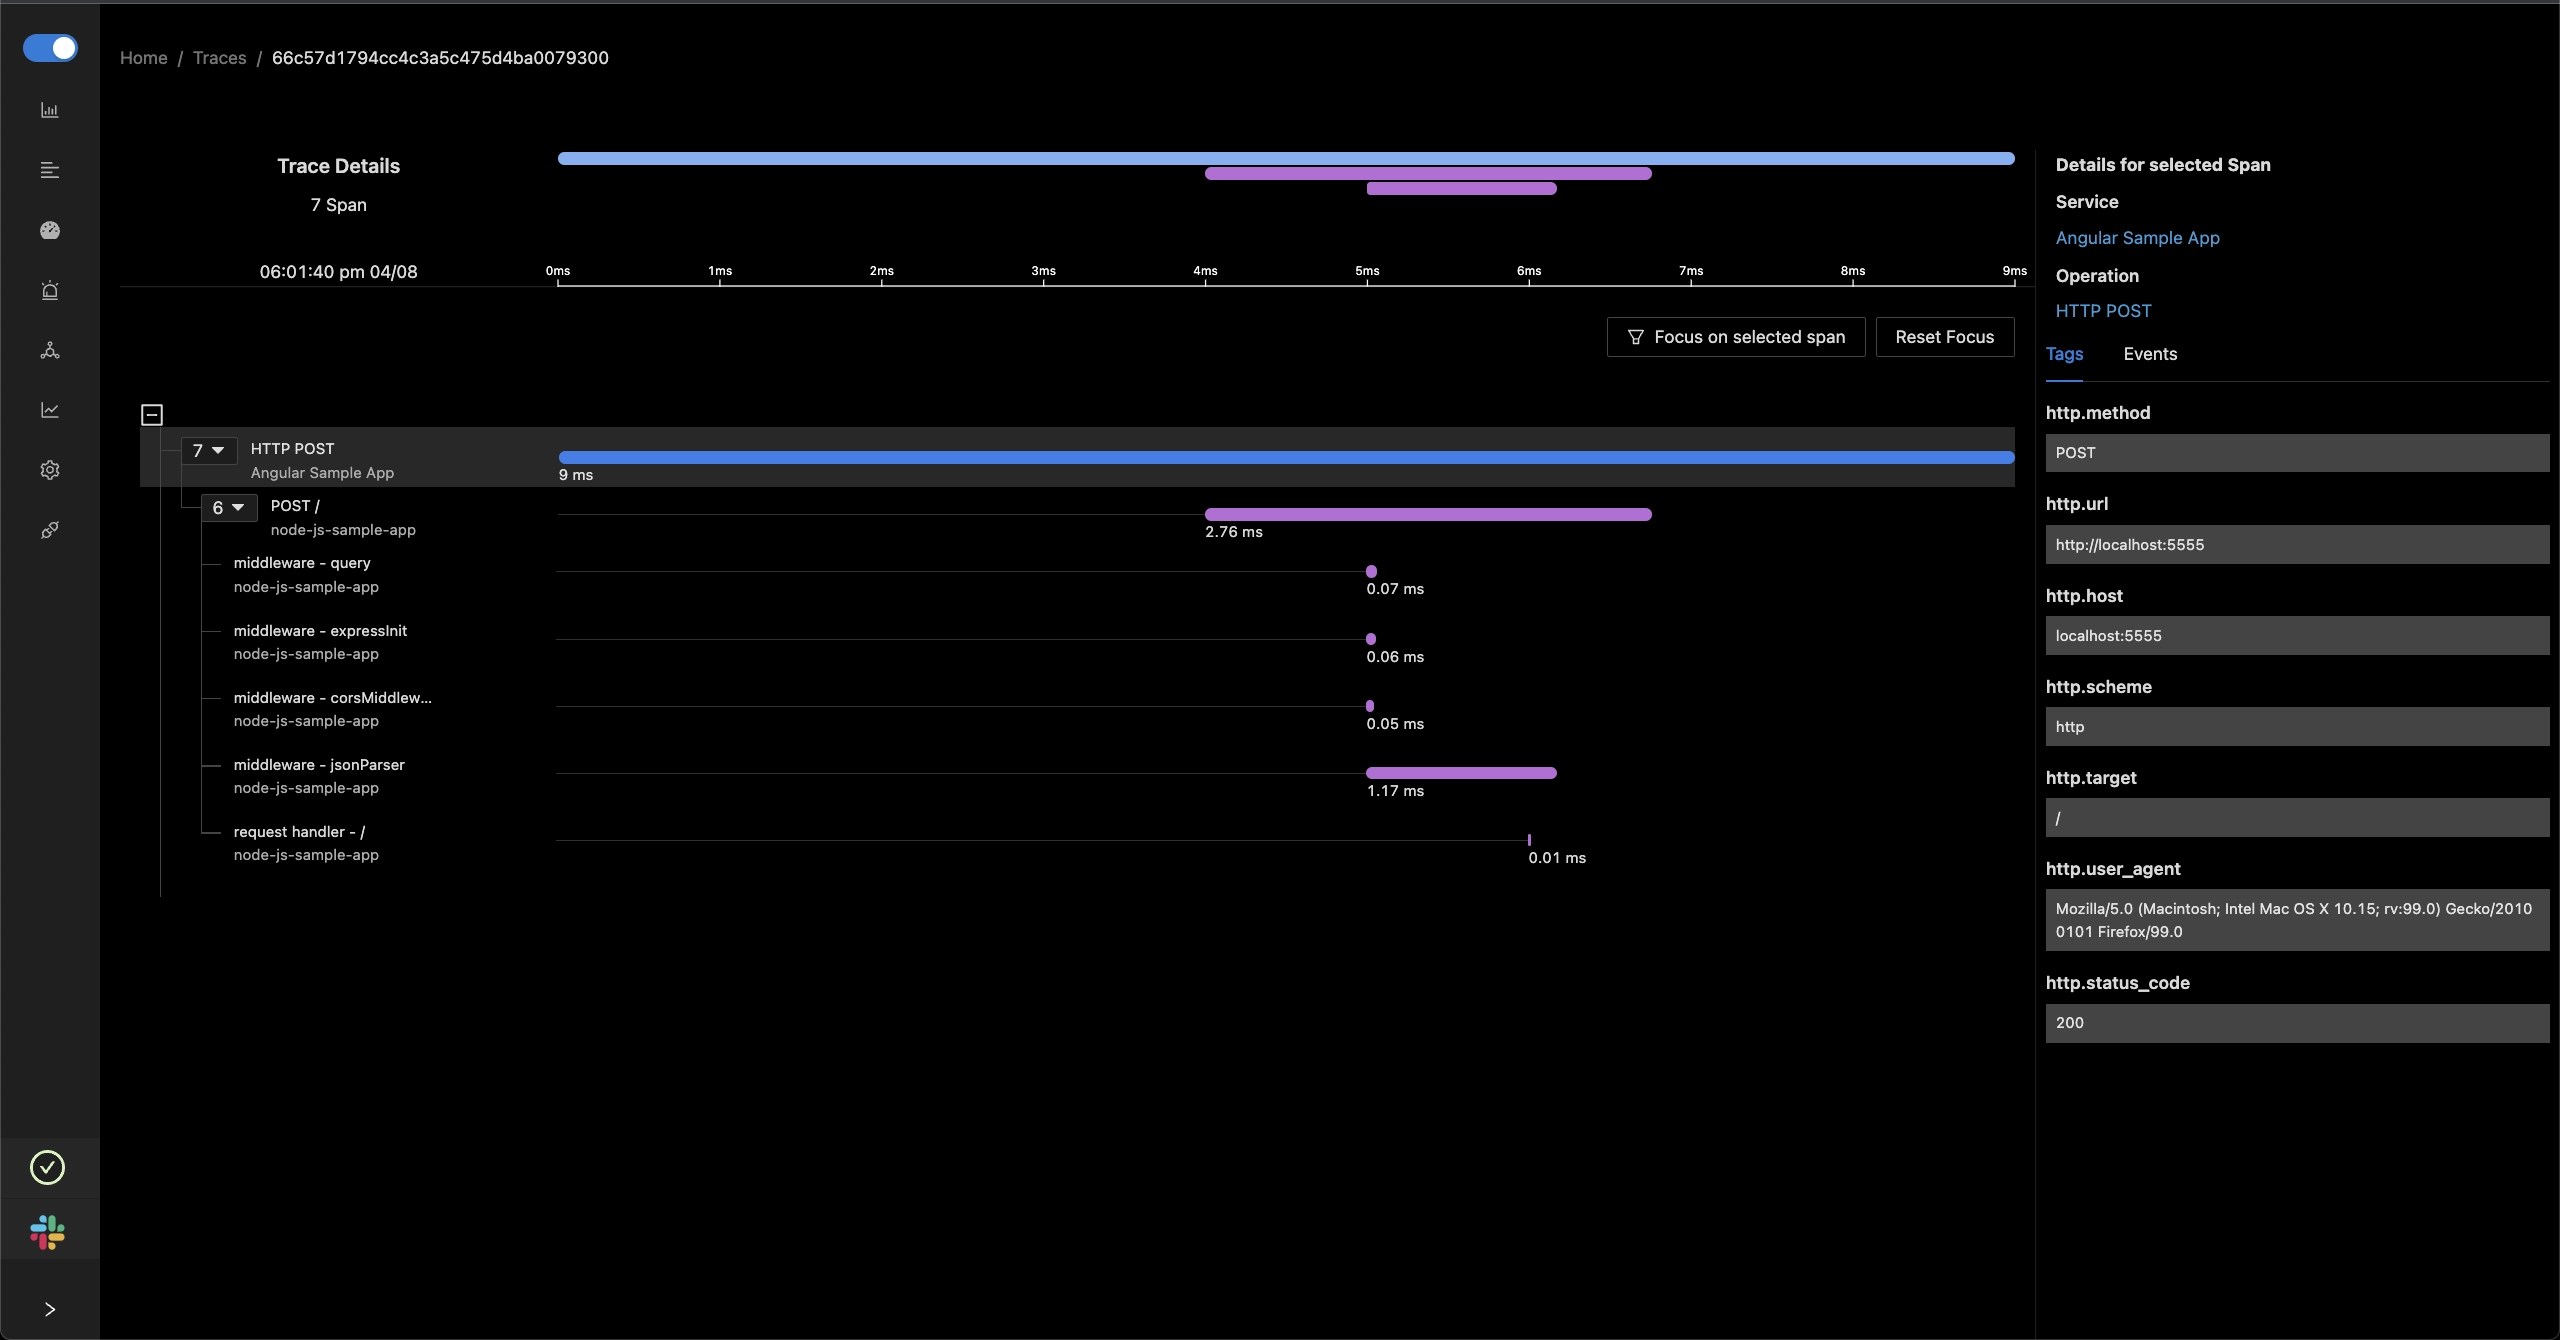
Angular OpenTelemetry Instrumentation

This document contains instructions on how to set up OpenTelemetry instrumentation in your Angular applications. OpenTelemetry, also known as OTel for short, is an open source observability framework that can help you generate and collect telemetry data - traces, metrics, and logs from your Nestjs application.
Once the telemetry data is collected, you can configure an exporter to send the data to SigNoz.
There are three major steps to using OpenTelemetry:
- Instrumenting your Angular application with OpenTelemetry
- Configuring exporter to send data to SigNoz
- Validating that configuration to ensure that data is being sent as expected.
Instrumenting your Angular App with OpenTelemetry 🛠
Pre-requisites
Enable CORS in the OTel Receiver. Inside docker/clickhouse-setup/otel-collector-config.yaml add the following CORS config. You can view the file at SigNoz GitHub repo.
      http:
+        cors:
+          allowed_origins:
+            - https://netflix.com  # URL of your Frontend application
Make sure to restart the container after making the config changes
Now let's get back to instrumenting our Angular Application. Let's start by installing a couple of dependencies.
npm i @jufab/opentelemetry-angular-interceptor && npm i @opentelemetry/api @opentelemetry/sdk-trace-web @opentelemetry/sdk-trace-base @opentelemetry/core @opentelemetry/semantic-conventions @opentelemetry/resources @opentelemetry/exporter-trace-otlp-http @opentelemetry/exporter-zipkin @opentelemetry/propagator-b3 @opentelemetry/propagator-jaeger @opentelemetry/context-zone-peer-dep @opentelemetry/instrumentation @opentelemetry/instrumentation-document-load @opentelemetry/instrumentation-fetch @opentelemetry/instrumentation-xml-http-request @opentelemetry/propagator-aws-xray --save-dev
Not let's import OTel module in app.module.ts
import {
  OpenTelemetryInterceptorModule,
  OtelColExporterModule,
  CompositePropagatorModule,
} from '@jufab/opentelemetry-angular-interceptor';

@NgModule({
  ...
  imports: [
    ...
    OpenTelemetryInterceptorModule.forRoot({
      commonConfig: {
        console: true, // Display trace on console (only in DEV env)
        production: false, // Send Trace with BatchSpanProcessor (true) or SimpleSpanProcessor (false)
        serviceName: 'Angular Sample App', // Service name send in trace
        probabilitySampler: '1',
      },
      otelcolConfig: {
        url: 'http://127.0.0.1:4318/v1/traces', // URL of opentelemetry collector
      },
    }),
    //Insert OtelCol exporter module
    OtelColExporterModule,
    //Insert propagator module
    CompositePropagatorModule,
  ],
  ...
})
This config would be enough to get you up and running. For more tweaks refer to this detailed documentation of the instrumentation library.
Facing difficulties with instrumenting your application? Check out this video tutorial 👇

Sample Angular App
- Sample Angular App - Contains without-instrumentation branch as well as instrumented branch
main.
Frequently Asked Questions
How to find what to use in
IP of SigNozif I have installed SigNoz in Kubernetes cluster?Based on where you have installed your application and where you have installed SigNoz, you need to find the right value for this. Please use this grid to find the value you should use for
IP of SigNozI am sending data from my application to SigNoz, but I don't see any events or graphs in the SigNoz dashboard. What should I do?
This could be because of one of the following reasons:
Your application is generating telemetry data, but not able to connect with SigNoz installation
Please use this troubleshooting guide to find if your application is able to access SigNoz installation and send data to it.
Your application is not actually generating telemetry data
Please check if the application is generating telemetry data first. You can use
Console Exporterto just print your telemetry data in console first. Join our Slack Community if you need help on how to export your telemetry data in consoleYour SigNoz installation is not running or behind a firewall
Please double check if the pods in SigNoz installation are running fine.
docker psorkubectl get pods -n platformare your friends for this.