Top 10 Log Analysis Tools that You Can Consider [2024 Guide]
Logs are essential for diagnosing downtimes, identifying security breaches, and troubleshooting errors. As systems and applications are in operation, they tend to produce a vast array of log files depending on the complexity of the system, the number of applications running, and the configurations in place. In the event of an application or system error, manually gathering and reviewing these logs for troubleshooting purposes can be time-consuming.
Adopting a log analysis tool is highly recommended to streamline this process and remove the manual burden. Log analysis tools automate the process of collecting, parsing, and analyzing log data, making troubleshooting more efficient and less time-consuming. They are software applications that collect, parse, and analyze log data to help developers monitor, debug, and optimize their applications.
In this article, we will look at top log analysis tools in the market that are designed to streamline the process of managing and interpreting log files.
Top 10 Log Analysis Tools
In this section, we will discuss the top 10 log analysis tools you can consider using. They are:
SigNoz
SigNoz is a full-stack open-source observability tool that provides log collection and analytics. SigNoz uses a columnar database ClickHouse to store logs, which is very efficient at ingesting and storing logs data. ClickHouse is designed for faster analytics with advanced querying. It makes SigNoz 2.5x faster than Elasticsearch while consuming 50% less resources.
SigNoz provides logs, metrics, and traces under a single pane of glass. Since everything is under a single datastore, you can have rich insights by correlating signals like logs and traces. It also saves you from the overhead of managing multiple tools for monitoring and observability.
SigNoz uses OpenTelemetry for instrumenting applications. OpenTelemetry, backed by CNCF, is quietly becoming the world standard for instrumenting cloud-native applications. You can collect logs from your application using the OpenTelemetry SDK or just forward your logs to OpenTelemetry collector using your existing logging pipeline.
After sending logs to SigNoz, you can use an intuitive query builder to filter and search through your logs. You can build charts, save views for quick access, and set up alerts.
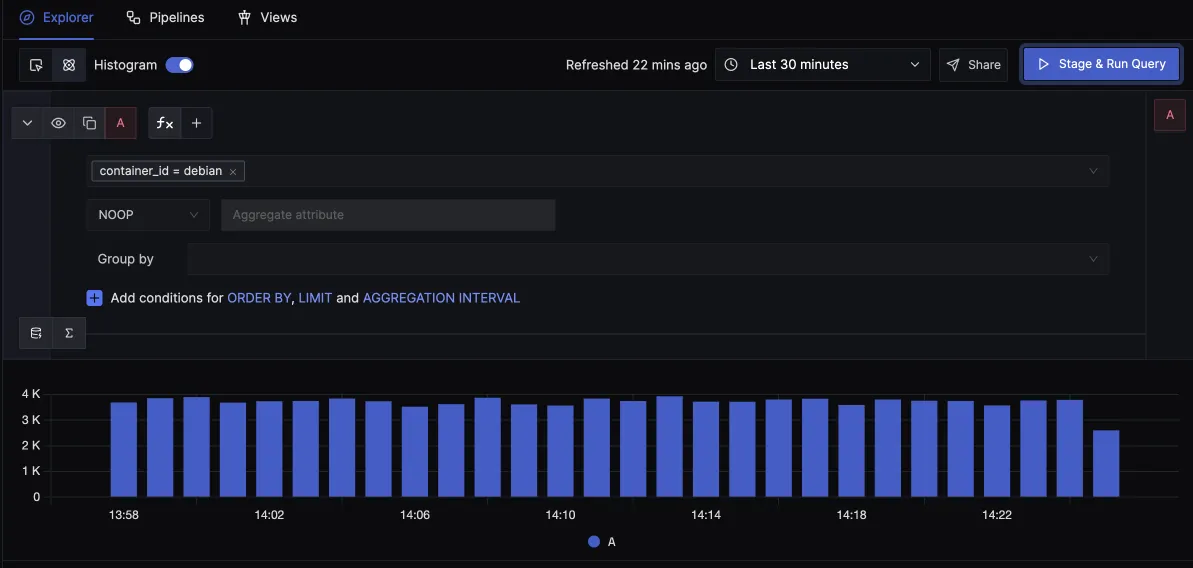
Save views for quick access later.
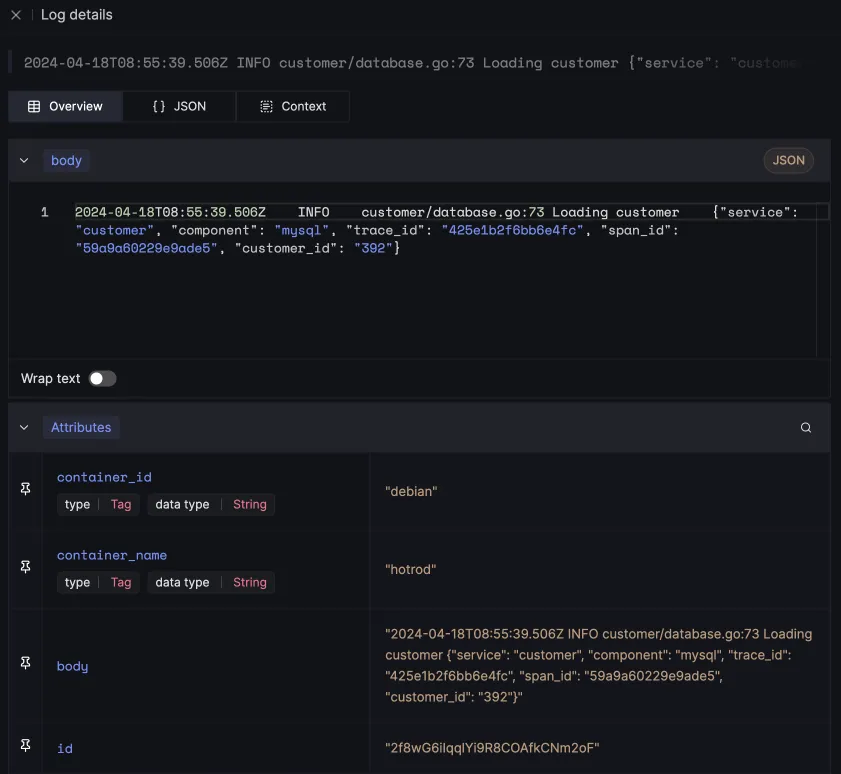
You can view your logs in detailed view with attributes, in json format and context tab that shows logs before and after the selected log from the same source.
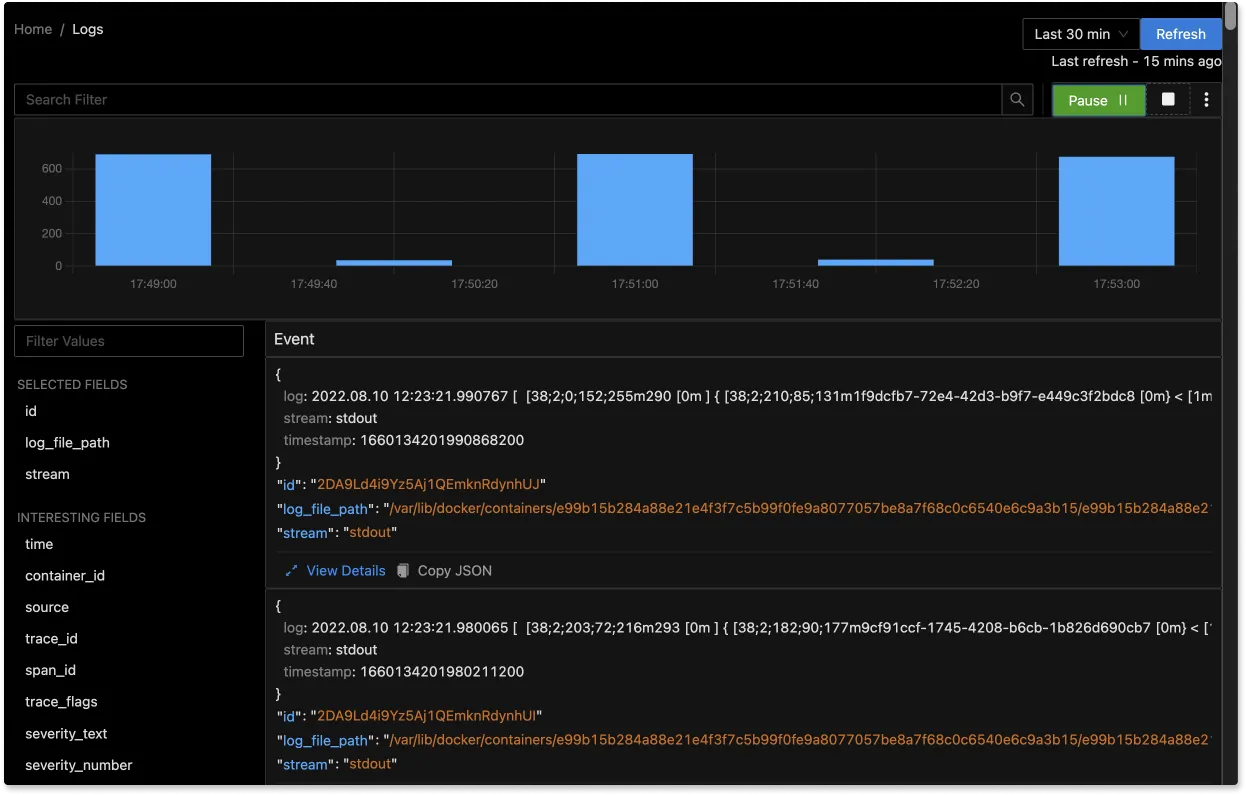
You can also view logs in real time with live tail logging.
With Logs Pipelines, you can transform logs to suit your querying and aggregation needs before they get stored in the database, thus saving a lot of cost.
SigNoz cloud is the easiest way to run SigNoz. Sign up for a free account and get 30 days of unlimited access to all features.
Splunk
Splunk is a software platform that specializes in the collection, analysis, and visualization of machine-generated big data.
Splunk ingests data from various sources, including logs, network traffic, and other machine-generated data. This data is then indexed and stored in a searchable format. Users can query this data using Splunk's proprietary search language, SPL (Search Processing Language), to find specific events, patterns, or anomalies within the data.
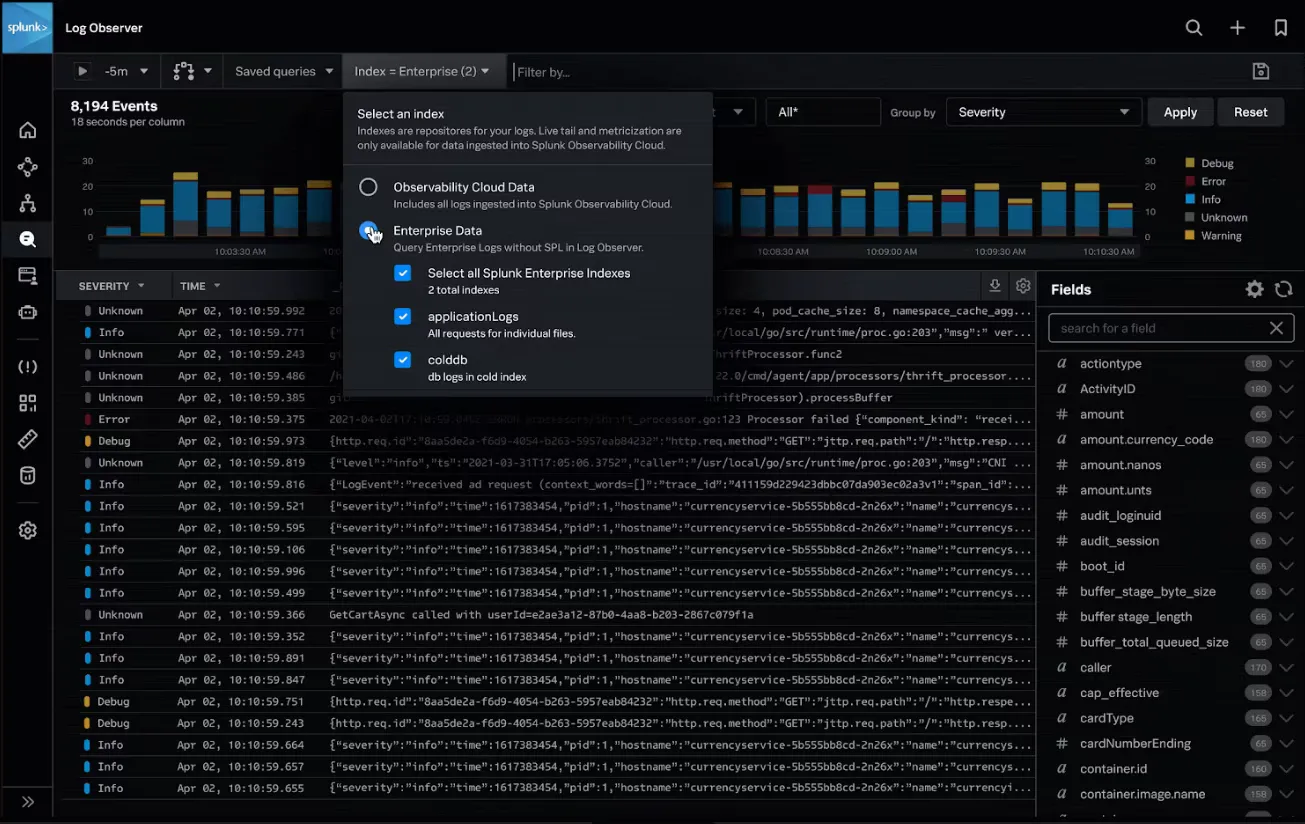
Some key features of Splunk are:
- In-depth log analytics
- Extensive search capability
- Powerful search and filtering
- ML-based analytics
Graylog
Graylog is a powerful open-source log management platform that helps in collecting, indexing, and analyzing log data from various sources. It is designed to handle large volumes of data and provides a centralized location for storing, searching, and analyzing log data.
Graylog ingests log data from various sources, including servers, applications, and network devices. Once the data is ingested, Graylog parses it into a structured format that can be easily searched, analyzed, and visualized. This structured data is stored in a database, allowing for efficient querying and analysis.
Graylog supports a wide range of data formats, including syslog, log4j, and many others, making it versatile for analyzing different types of log data.
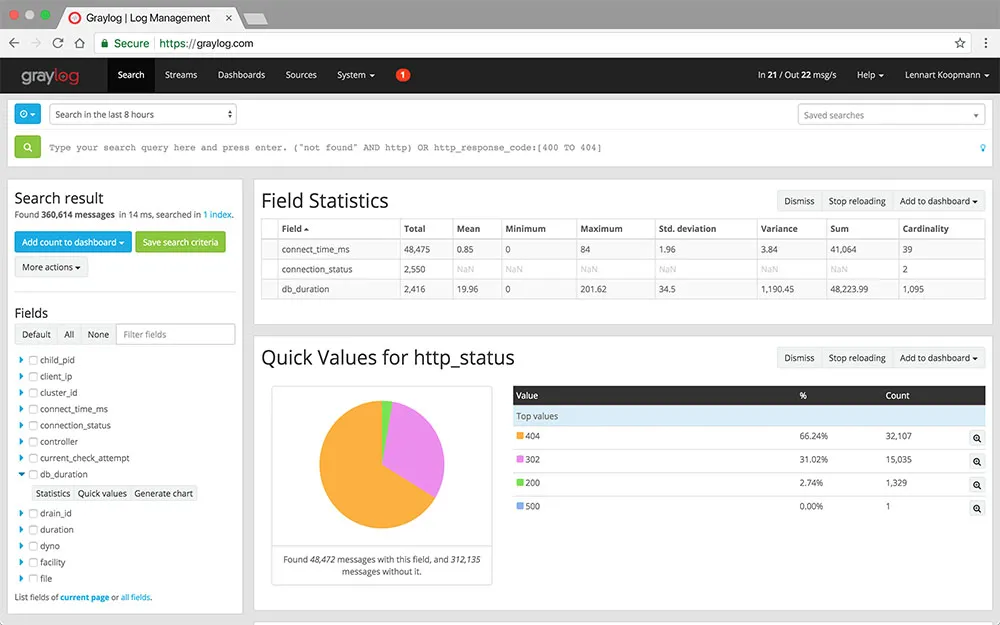
Some key features of Graylog are:
- Log data collection and analysis
- Data processing pipeline
- Search and analysis capabilities
- Alerting and notifications
- RESTful API
- Scalability
- Multi-data inputs and outputs
SumoLogic
SumoLogic is a leading cloud-native SaaS log analytics platform. It centrally collects and analyzes log data in real-time, enabling organizations to proactively troubleshoot and resolve issues before they can impact the health and performance of their applications and systems.
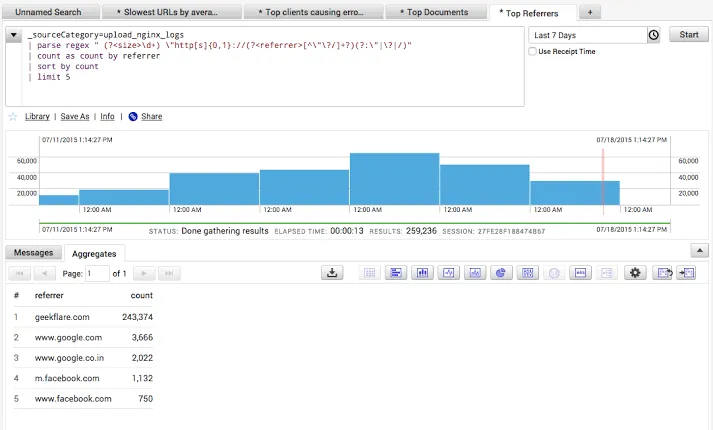
Some key features of Sumo Logic are:
- In-built pattern detection
- Predictive analysis
- Anomaly detection
- Log analytics
Elasticsearch
Elasticsearch is a powerful log analysis tool that is part of the Elastic Stack (previously known as the ELK stack). It is a distributed search and analytics engine that indexes, analyzes, and searches ingested log data.
Elasticsearch works hand in hand with Logstash and Kibana for log analysis. Logstash is primarily responsible for collecting, parsing, and processing logs from a variety of sources. Once processed, these logs are then sent to Elasticsearch for analysis. Kibana, on the other hand, is utilized for visualizing the ingested log data, allowing users to filter and search through the data more effectively.
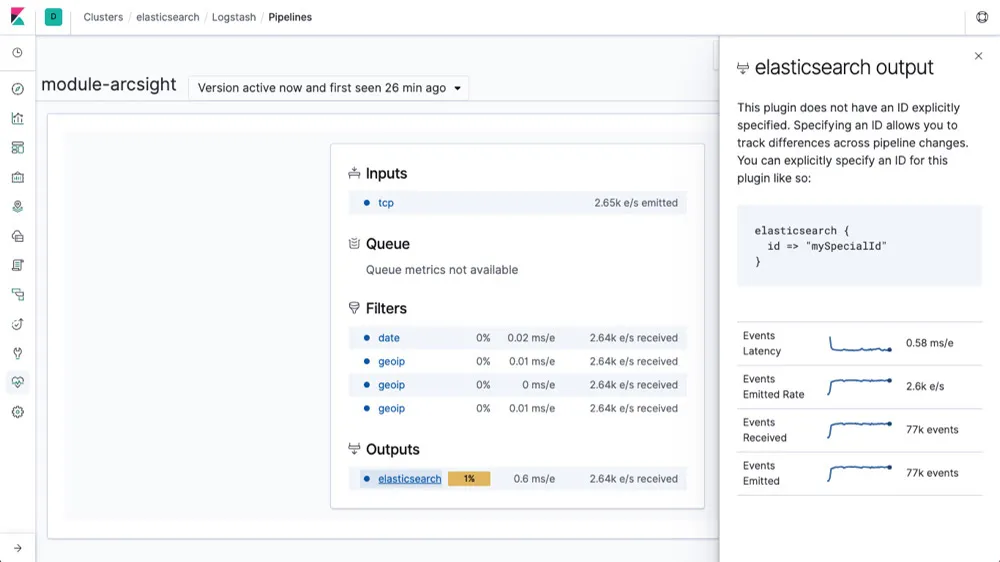
Some key features of Elasticsearch are:
- Full-Text Search
- Real time analytics
- Log and event data analysis
- Integration with other Elastic Stack components
Datadog
Datadog is a comprehensive monitoring and analytics platform that excels as a log analysis tool, offering a robust suite of features designed to simplify the process of analyzing and interpreting log data.
Datadog transforms unstructured streams of raw log data into centralized, structured datasets. It automatically applies tags to logs after ingestion and lets you analyze large volumes of log data and perform complex investigations without having to learn a complex query language.
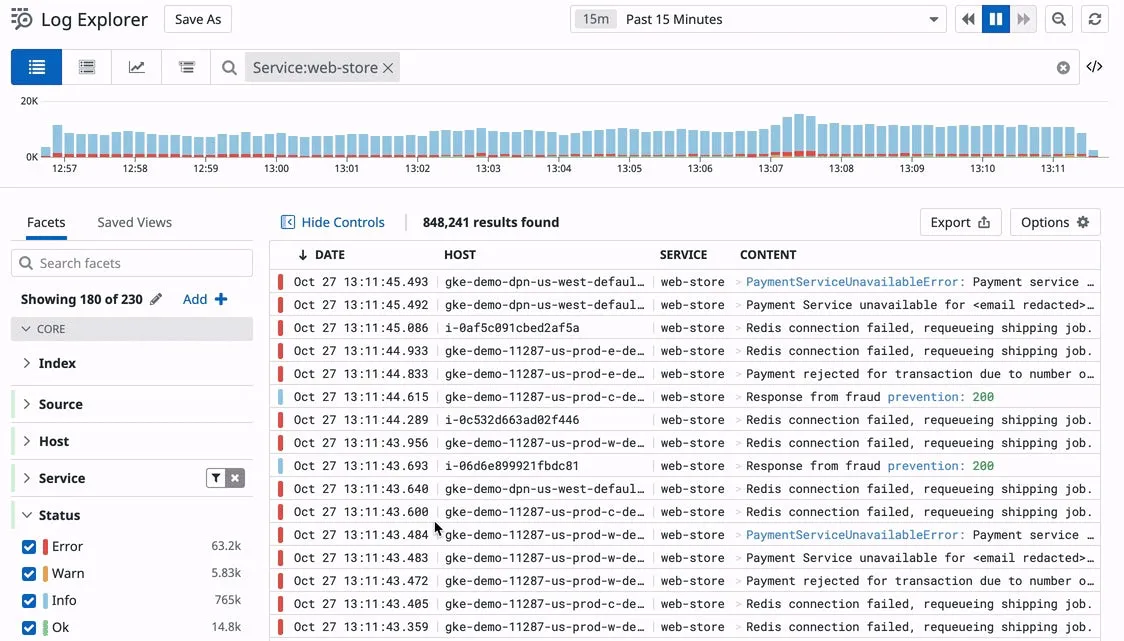
Some key features of Datadog are;
- Log anomaly detection
- Logging without limits
- Log analysis
- Log pattern and
Logwatch
Logwatch is an open-source log analysis tool designed to automatically parse and analyze log files from various services and applications running on Linux or Unix-based systems. It presents a summary of the log data, including system activity, security events, and potential issues in a detailed, easy-to-read format, making it simple to identify and troubleshoot problems.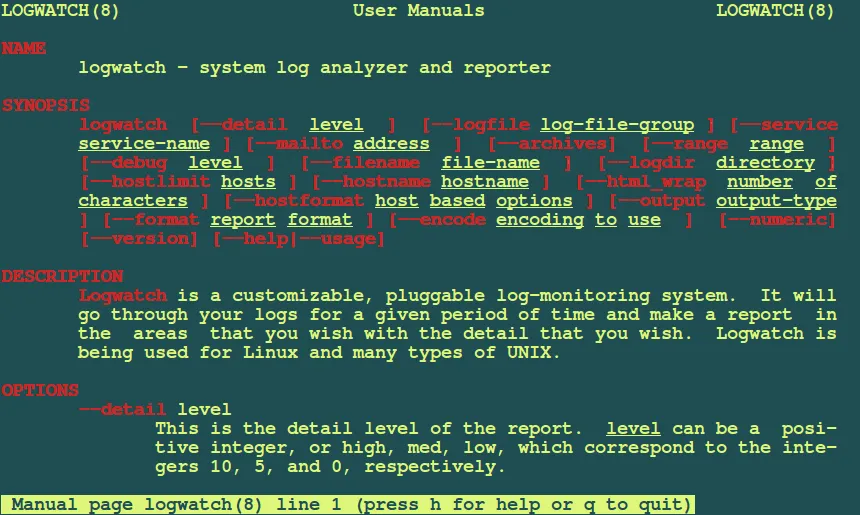
Some key features of Logwatch:
- Log data analysis
- Customizable filter scripts
- Output filtering and control
- Summary of system activity, security events, and potential problems
- Ability to filter out specific log entries
Logic Monitor
LogicMonitor is a cloud-based infrastructure monitoring and analytics platform that serves as an impressive log analysis tool. It takes a unique and unified approach to log analysis by utilizing algorithmic root-cause analysis to identify normal patterns and deviations from these patterns within log events.
As logs are being ingested into the platform, Logic Monitor parses the information contained within log lines, making it readily available for searching and data analysis. This methodology allows for a more efficient and accurate analysis of log data.
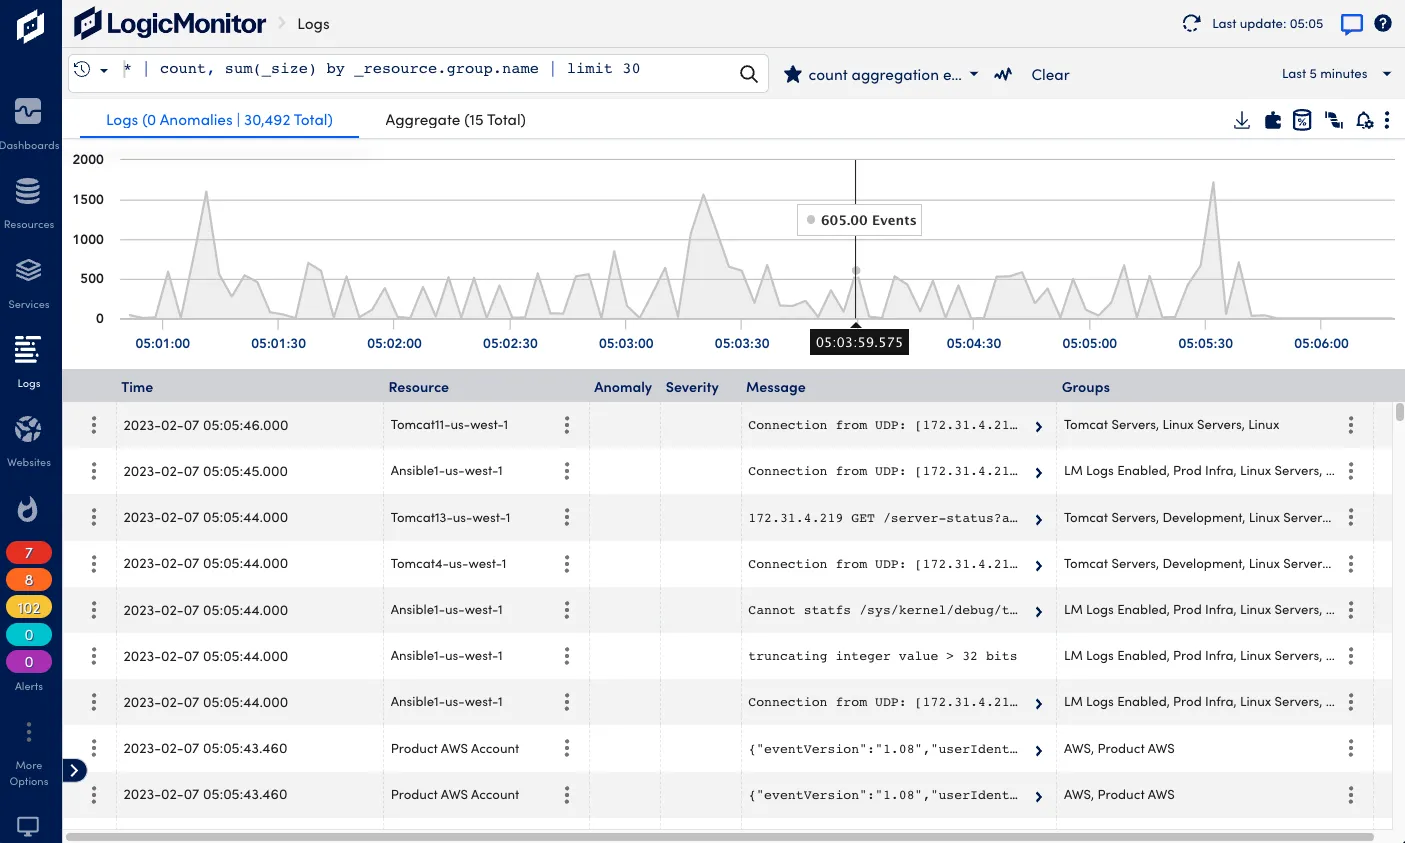
Some key features of Logic Monitor are;
- Intelligent log analytics
- Log collection
- Algorithmic Root-Cause Analysis
- Anomaly detection
Sematext
Sematext is a comprehensive log management platform that extends the capabilities of the Elastic Stack. This allows it to ingest logs from a wide variety of sources, such as log shippers, logging libraries, and more. Sematext provides robust searching, filtering, and tagging functionalities for efficient log analysis and anomaly detection.
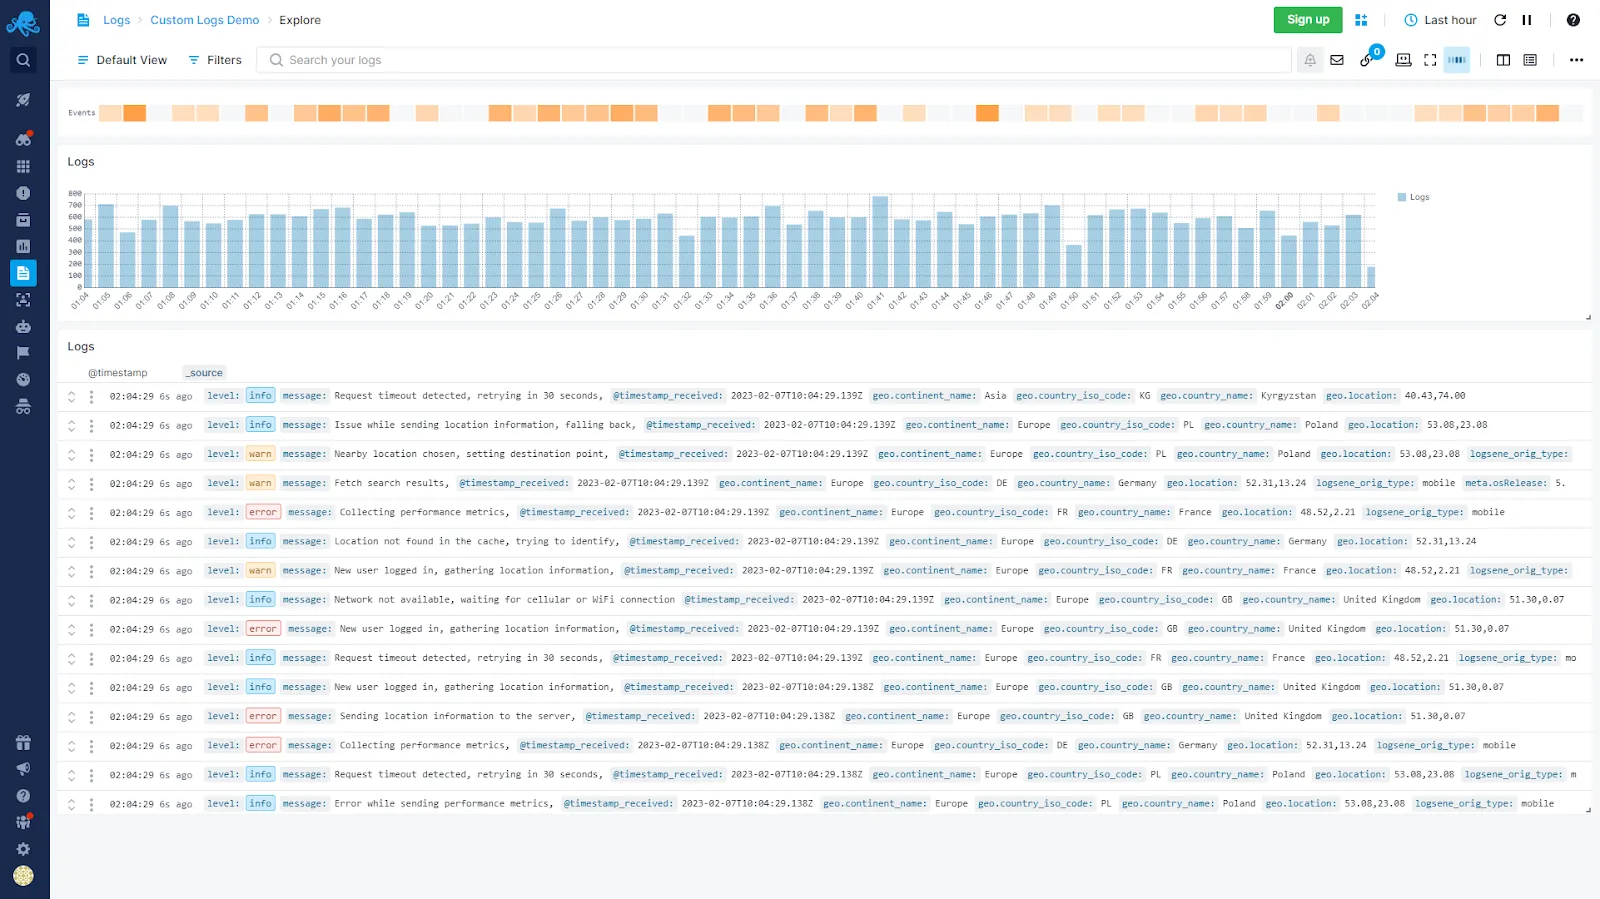
Some key features of Sematext are;
- Audit-proof logging
- Rich query syntax
- Automated Log Parsing and Structuring
- Advanced search and filtering
SolarWinds
SolarWinds provides a wide range of products designed to help organizations manage their IT infrastructure more effectively. One of its notable offerings is the SolarWinds Log Analyzer, a powerful tool that aggregates log data to provide deep insights into system performance and security.
SolarWinds Log Analyzer provides a powerful keyword search engine that allows users to search through logs without the need for any query language. Additionally, it comes with predefined filters that enable users to quickly identify logs based on criteria such as severity level and IP address, streamlining the process of troubleshooting and monitoring. As logs are ingested, it automatically assigns a severity indicator to each log entry, helping users to quickly identify and prioritize performance issues.
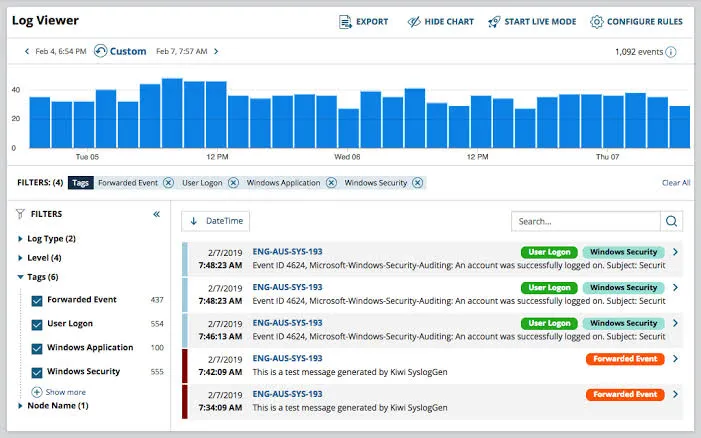
Some key features of SolarWinds are;
- Event log tagging
- Powerful search and filter
- Flat log file ingestion
- Log collection and analysis
- Log forwarding and
- Logs Observer Connect
Choosing the right log analysis tool
Selecting the appropriate log analysis tool involves evaluating several key factors to ensure it meets your organization's specific needs. Here are some considerations to keep in mind:
- Data Collection and Ingestion: Understand how the tool collects and ingests log data. This includes the types of data sources it can handle, the protocols it supports, and its ability to scale with the volume of logs.
- Cost: Consider the financial implications. This includes the upfront cost of the tool, any ongoing subscription fees, and the potential costs associated with scaling the tool as your log data grows.
- Open Source vs. Proprietary: Decide whether an open-source solution, which offers flexibility and community support, or a proprietary tool, which might provide more advanced features and dedicated support, aligns better with your organization's needs and budget.
- Scalability: Assess the tool's ability to scale with your organization. As your log data volume increases, the tool should be able to handle the load without compromising performance.
- Integration Capabilities: Evaluate how well the tool integrates with your existing IT infrastructure and other tools and systems. Seamless integration can streamline your log analysis workflow and improve overall operational efficiency.
- Ease of Use: Consider the tool's user interface and documentation. A tool that is easy to use and well-documented can reduce the learning curve and increase productivity among your team.
- Visualization Options: Look for tools that offer robust visualization capabilities. Effective visualization can help you identify trends and anomalies in your log data more easily, facilitating faster decision-making.
SigNoz is an excellent log analysis tool to consider as it ticks the above checkboxes. It provides logs, metrics, and traces under a single pane of glass with an intelligent correlation between the three types of telemetry signals.
Getting started with SigNoz
SigNoz cloud is the easiest way to run SigNoz. Sign up for a free account and get 30 days of unlimited access to all features.
You can also install and self-host SigNoz yourself since it is open-source. With 16,000+ GitHub stars, open-source SigNoz is loved by developers. Find the instructions to self-host SigNoz.
Further Reading:
7 Open-Source Log Management Tools that you may consider in 2024


