Top 9 Appdynamics Competitors & Alternatives [2024 Guide]
AppDynamics is a popular app and infrastructure monitoring solution. It has an AIOps-driven alert system that makes it a full-stack solution for several monitoring use cases. But despite its capabilities, users usually seek alternatives. This article is a deep dive into why.
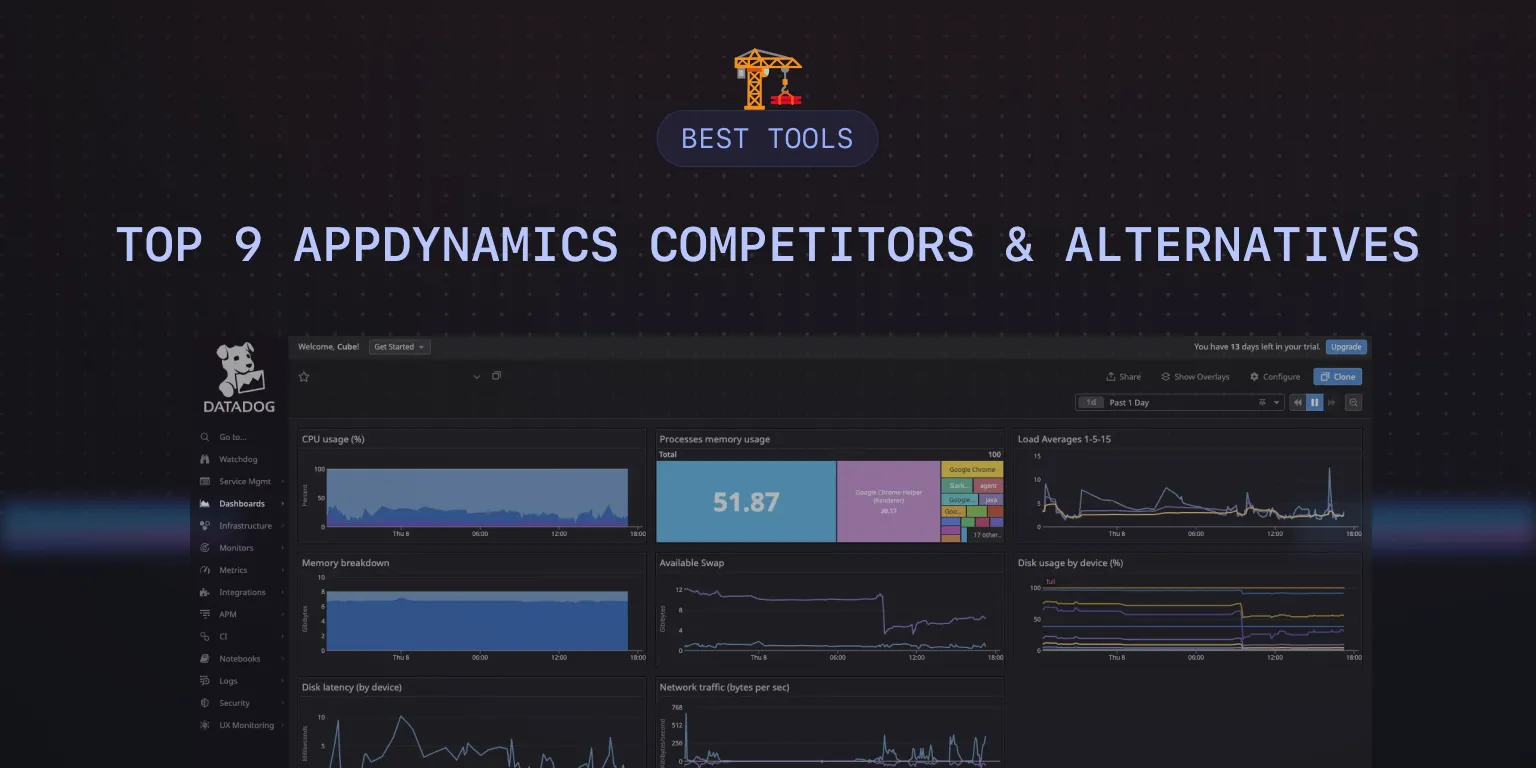
Why look for AppDynamics alternatives?
Enterprises seek alternatives to AppDynamics for five reasons: complexity, cost, agent-based monitoring, intensive sales process, and vendor lock-in and integration.
1. Complex UI
Although AppDynamics’ usability in several monitoring use cases is a plus, it also confers an increase to the tool’s features—all aggregating into an interface that is so complex you may have a tough time navigating it. While the team provided a docs platform to solve this challenge, it unfortunately also has a steep learning curve.
This doesn’t take away the fact that the tool has been appropriate for organizations with budgets large enough to contain training and onboarding allocations. Still, it also tells why smaller companies seem to jet-ski away from the tool.
2. Cost
Feature-rich tools—like Appdynamics—typically cost more. Although different packages and pricing models— the Premium, Enterprise, and Enterprise for SAP editions—exist for different company sizes, the tool’s licensing and subscription fees can be prohibitive. In the end, if the overall TCO (Total Cost of Ownership) of using AppDynamics exceeds its ROI (Return on Investment), companies will surely scout for a more cost-effective alternative.
3. Intensive Sales Process
AppDynamics' sales process is a call-to-sign-up approach that can span days or weeks. Developers don’t like to take sales calls. It introduces delays and scares off companies seeking a direct, autonomous approach to onboarding.
4. Agent-Based Monitoring
AppDynamics gathers data from your application using agents and controllers. Although agent-based solutions gather deeper performance insights, they can be complex and time-consuming to install, increase resource consumption, and introduce maintenance overhead. Enterprises that find the trade-offs of AppDynamics’ agent-based approach too steep surely port to AppDynamics’ competitors.
5. Vendor Lock-in and Integration
Since AppDynamics does not work with open-source platforms, it is difficult to integrate with or switch to other monitoring tools. Dependence on a single vendor for monitoring hinders interoperability with other tools. To prevent this limitation from impacting their ability to migrate in the future, organizations choose open-source solutions with broader integration capabilities.
Appdynamics’ Top 9 Competitors
Here are the top AppDynamics competitors—some fit specific requirements, and some are ideal for any use case.
1. SigNoz (open-source)
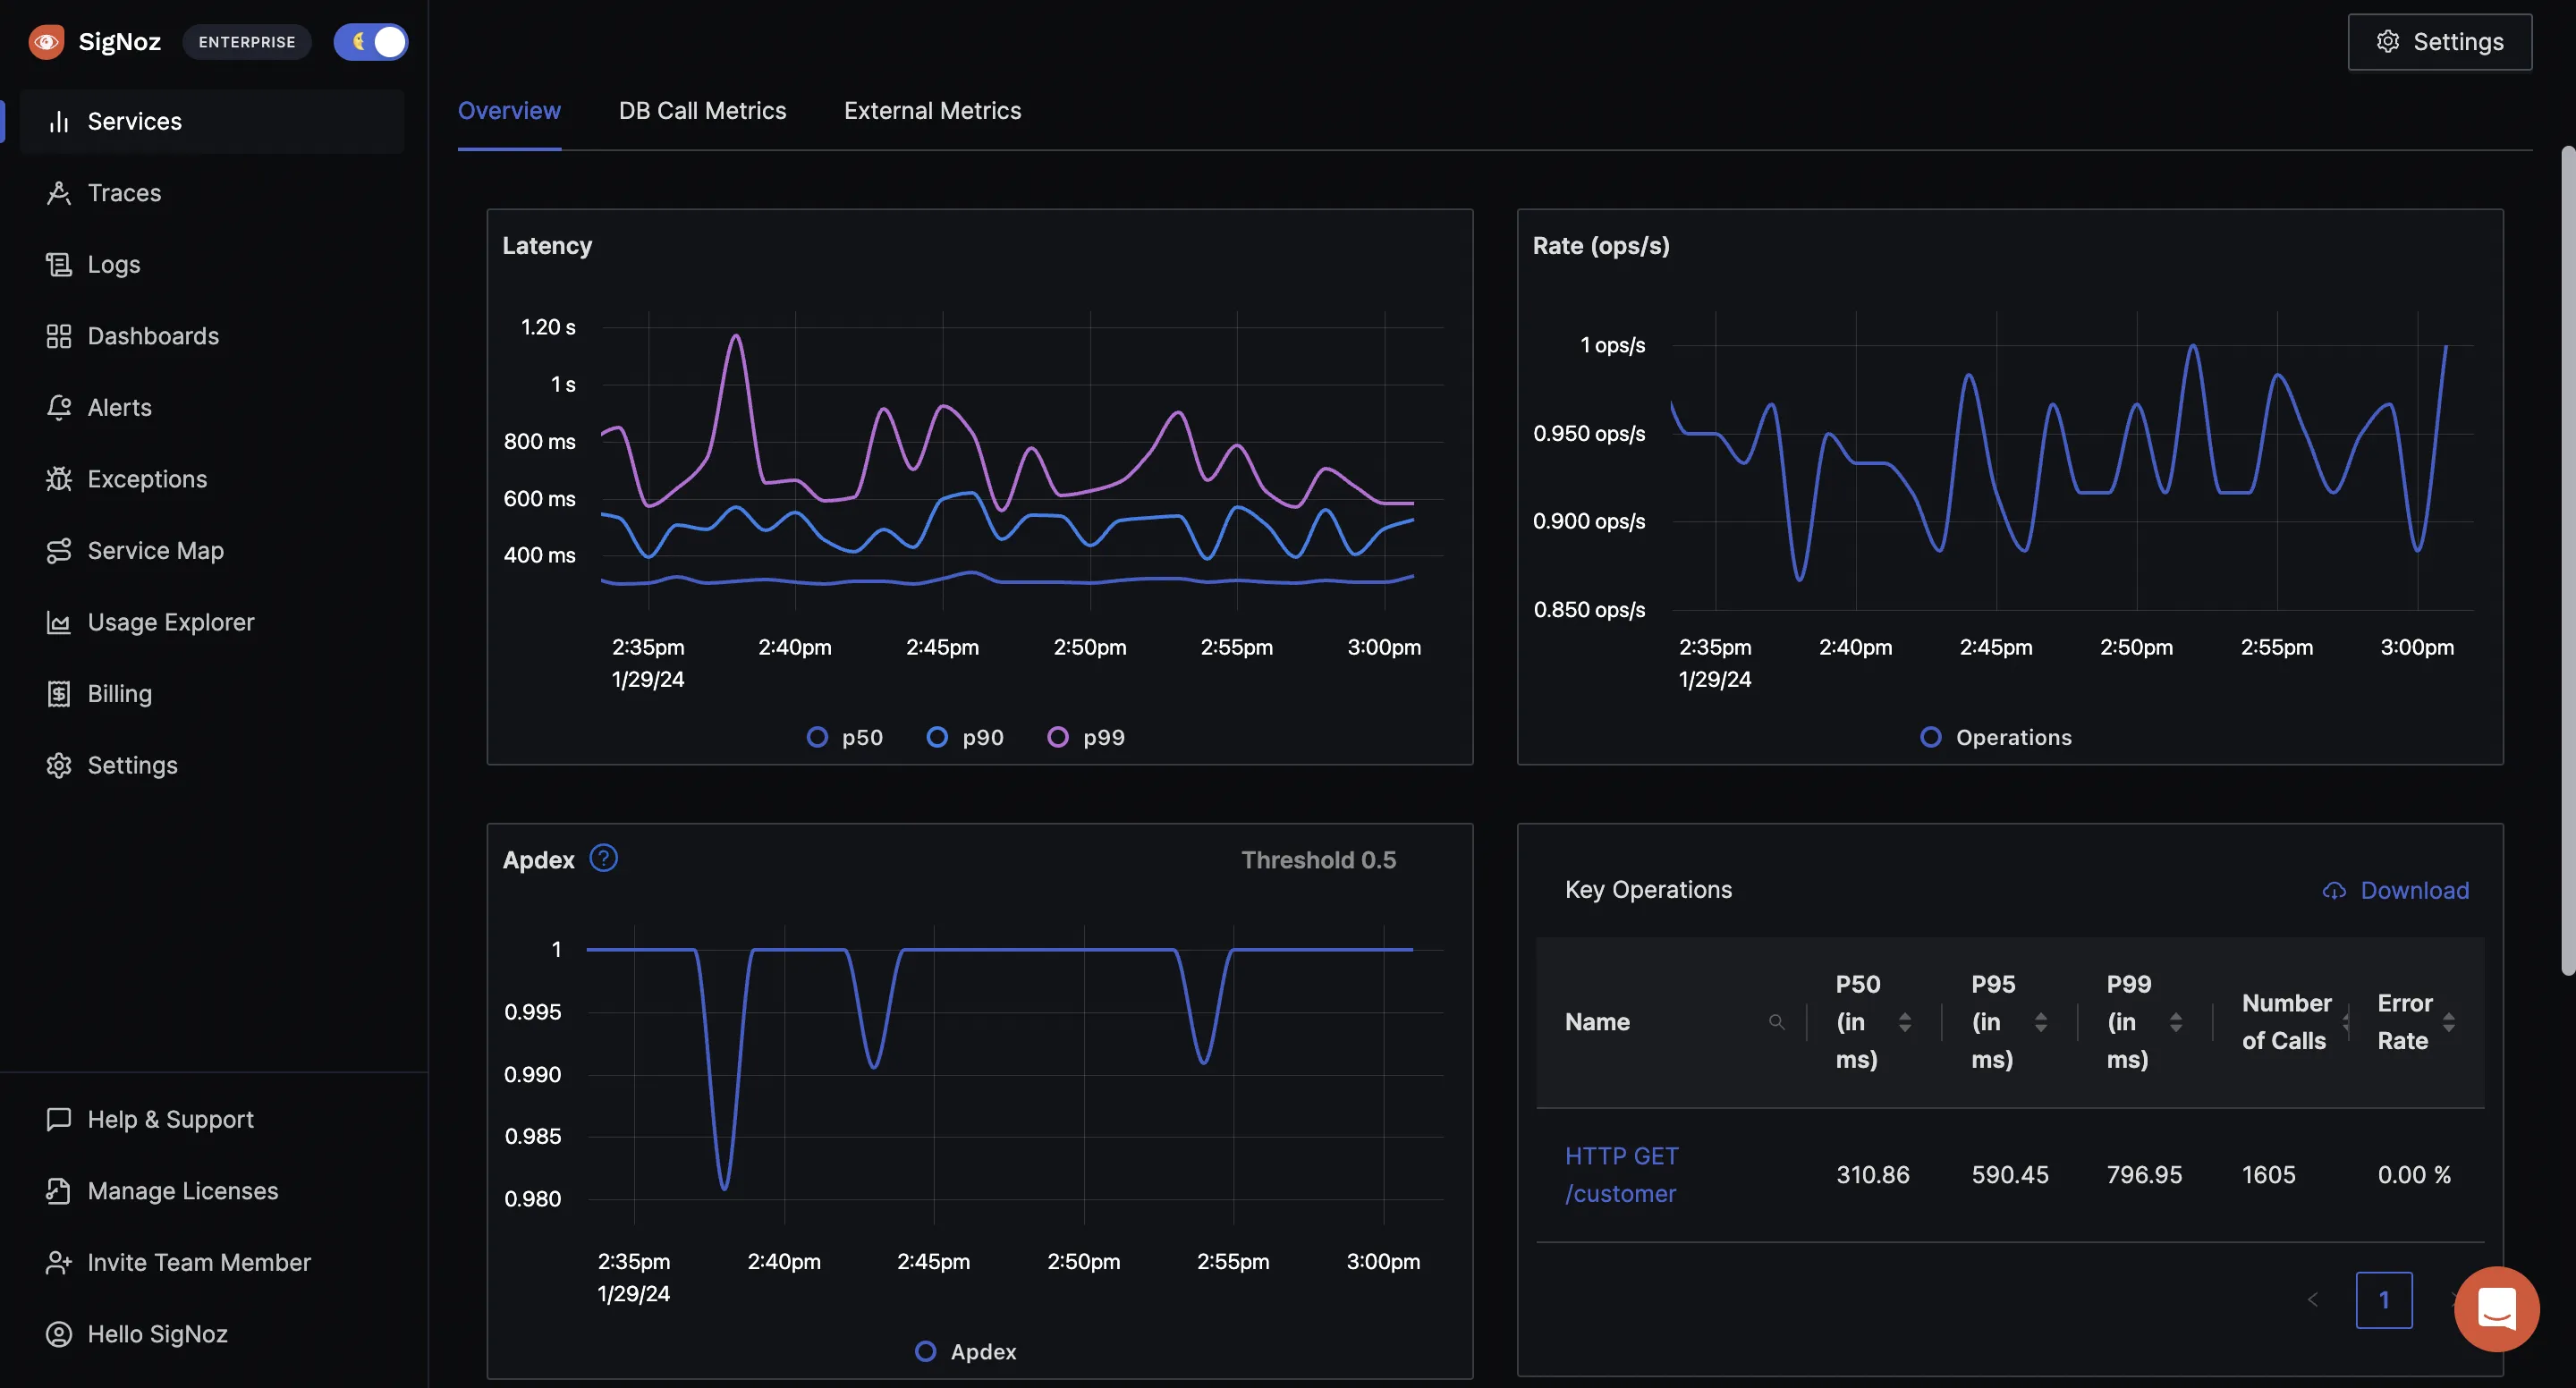
SigNoz is an open-source network and infrastructure monitoring tool that provides a unified user interface for analyzing and visualizing metrics, traces, and logs. With its advanced tagging and filtering, log aggregation, and distributed tracing capabilities, SigNoz provides deep insights into application latency, error rates, and throughput, helping teams identify and troubleshoot issues quickly.
As an agentless open-source tool, Signoz is highly customizable and adaptable to different environments. Its strong community support and easy-to-understand documentation make it a favored choice for many.
Features
- Visualise Traces, Metrics, and Logs in a single pane of glass
- Monitor application metrics like p99 latency, error rates for your services, external API calls, and individual endpoints.
- Find the root cause of the problem by going to the exact traces which are causing the problem and see detailed flamegraphs of individual request traces.
- Run aggregates on trace data to get business-relevant metrics
- Filter and query logs, build dashboards and alerts based on attributes in logs
- Monitor infrastructure metrics such as CPU utilization or memory usage
- Record exceptions automatically in Python, Java, Ruby, and Javascript
- Easy to set alerts with DIY query builder
Pricing
SigNoz cloud is the easiest way to run SigNoz. You can sign up here for a free account and get 30 days of unlimited access to all features. The cloud plan starts at $199 per month and has a simple and transparent usage-based pricing post that. You can check out the pricing page for more details.
2. Splunk
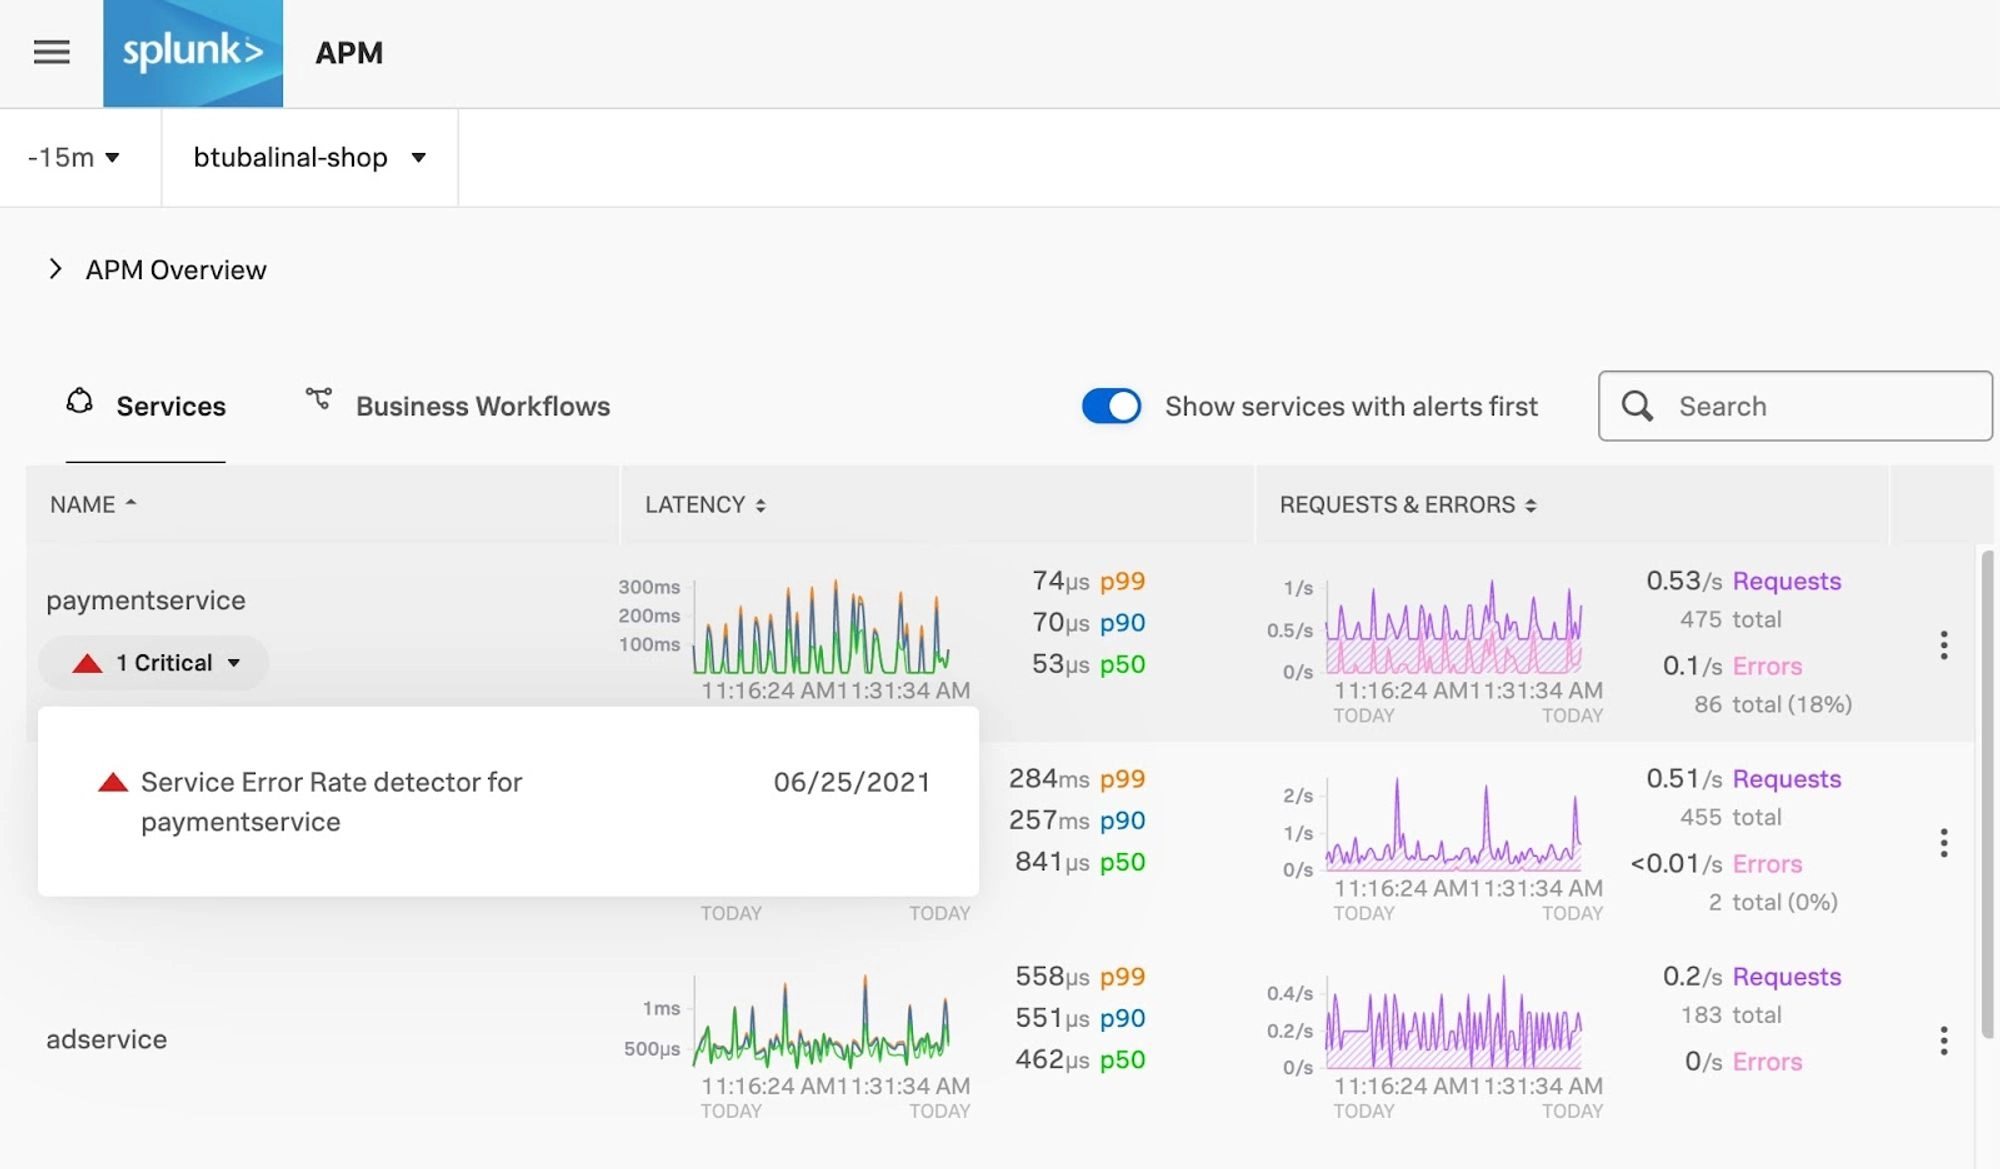
Splunk is a unified security and observability tool for monitoring and analyzing data in real-time. Through a web interface, Splunk collects, indexes and analyzes data at scale from various sources. Splunk stands out for its scalability and comprehensive data analytics capabilities. It however requires some technical expertise to set up and maintain its advanced features.
Features
- Powerful search capabilities and customizable dashboards
- Point-in-time alerting system for specific thresholds
- Integration with 300+ cloud services
- Security Information and Event Management (SIEM)
- AI capabilities and machine learning algorithms to identify patterns and anomalies and predict future trends in data.
Pricing
Splunk's pricing is categorized into workload, ingest, entity, and activity-based models. Workload pricing depends on workload types, ingest pricing on data volume, entity pricing on host numbers, and activity-based pricing on specific monitoring activities like metrics, traces, sessions, or uptime requests.
3. Sematext
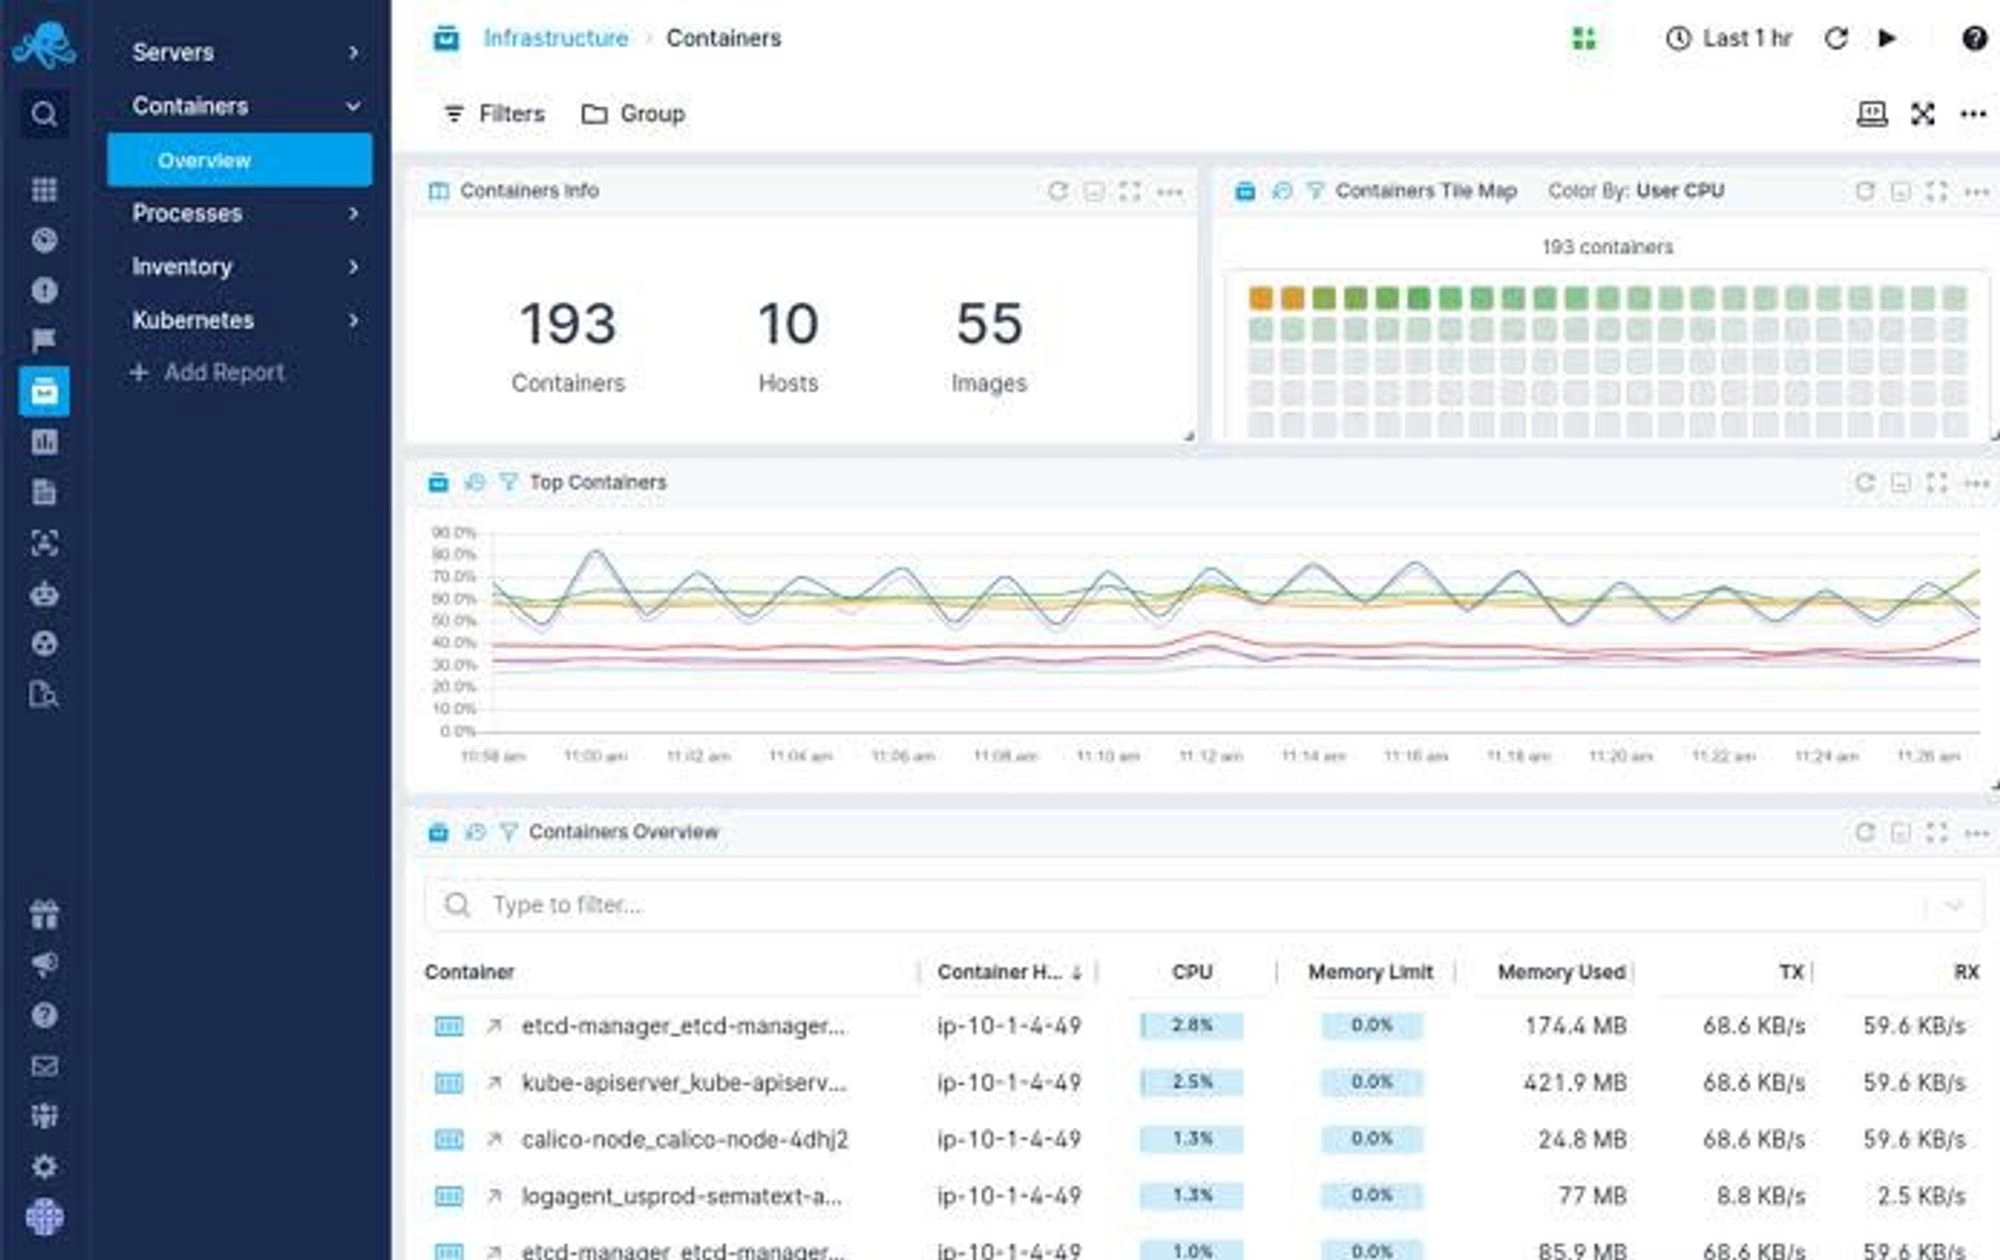
Sematext offers two packages—Sematext Cloud and Sematext Enterprise. While Sematext Cloud is a fully managed SaaS platform for infrastructure, application, and log management, Sematext Enterprise is a self-managed platform that allows businesses to maintain control over their monitoring environment. Sematext provides real-time insights into system performance, application health, and log data, enabling users to proactively identify and troubleshoot issues.
Features
- Consolidates logs, metrics, and traces in a single, user-friendly interface
- Monitors server performance metrics, container environments, databases, and cloud instances at varying costs
- Tracks application behavior, response times, and error rates
- Offers advanced search and analysis capabilities
- Enables log monitoring for troubleshooting and compliance.
Pricing
Sematext offers various pricing structures, including basic, pro, pay-as-you-go, and startup options. Its pricing plans are based on usage volume and features required. Infrastructure monitoring starts at $3.6 per month per host, service monitoring at $10.08 per month per agent, and log monitoring at $50 per month. Additional costs apply for log data received ($0.1/GB) and log data storage ($1.57 per GB).
4. SolarWinds
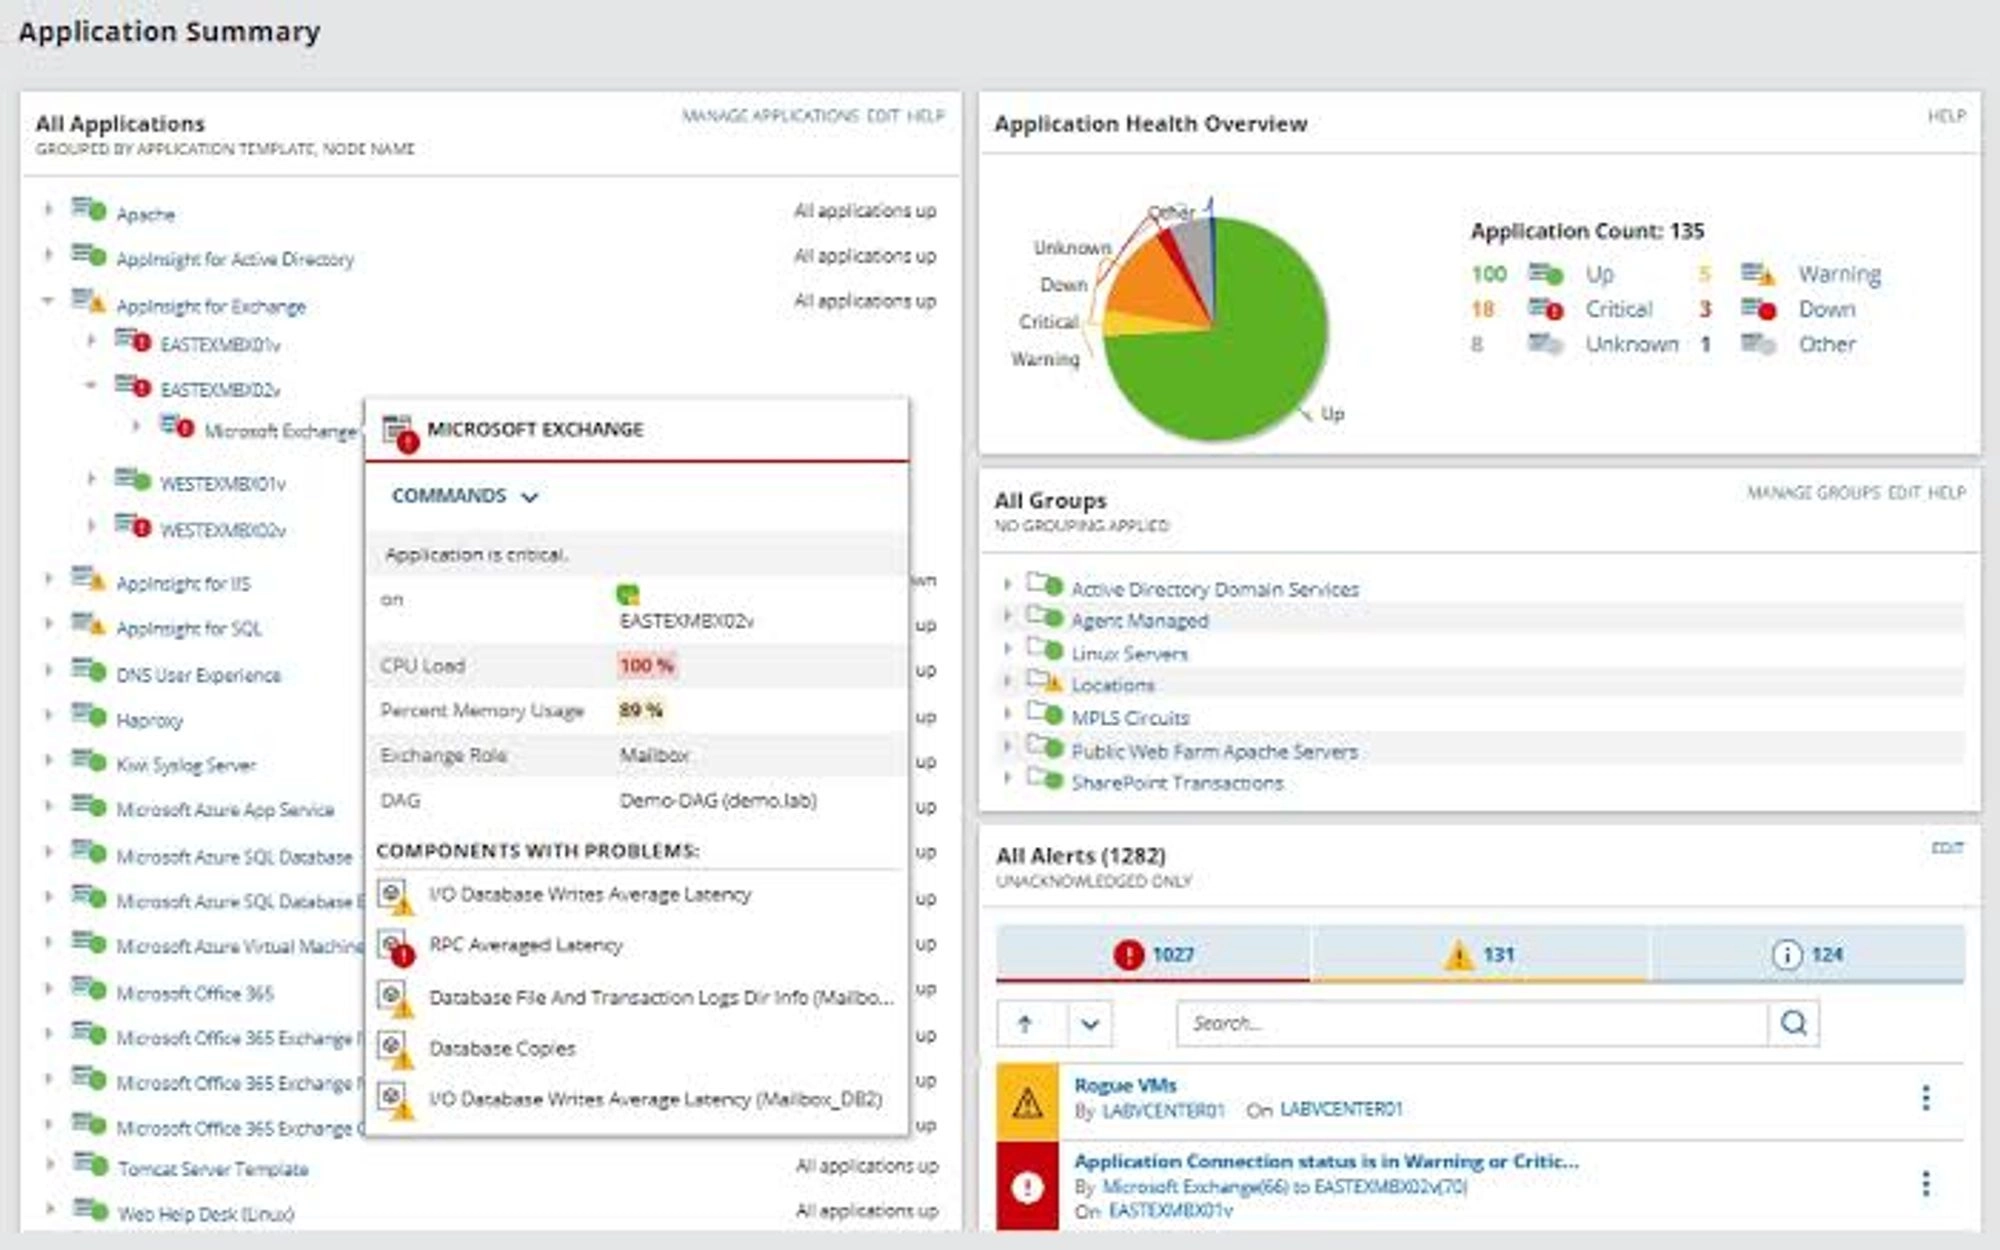
SolarWinds is a comprehensive monitoring and management tool that offers modules such as IT infrastructure, application, real-user and network performance monitoring. It provides the visibility and insights needed to monitor and optimize the performance of IT systems.
Features
- Network performance metrics, device health, and traffic patterns monitoring
- Support for hybrid cloud environments
- Comprehensive visualization tools e.g. customizable, topological maps for analyzing traffic flow
- Architecture security monitoring
- Customizable dashboards, alerts, and reports
- Regular updates and technical support
Pricing
SolarWinds offers a variety of pricing options based on the features and modules required. Application monitoring starts at $27.50 per app instance, Database monitoring at $70.00 per instance, Network and Infrastructure monitoring at $15.00 per active host, real-user monitoring at $10.00 per 100,000 page views, etc.
5. Nagios
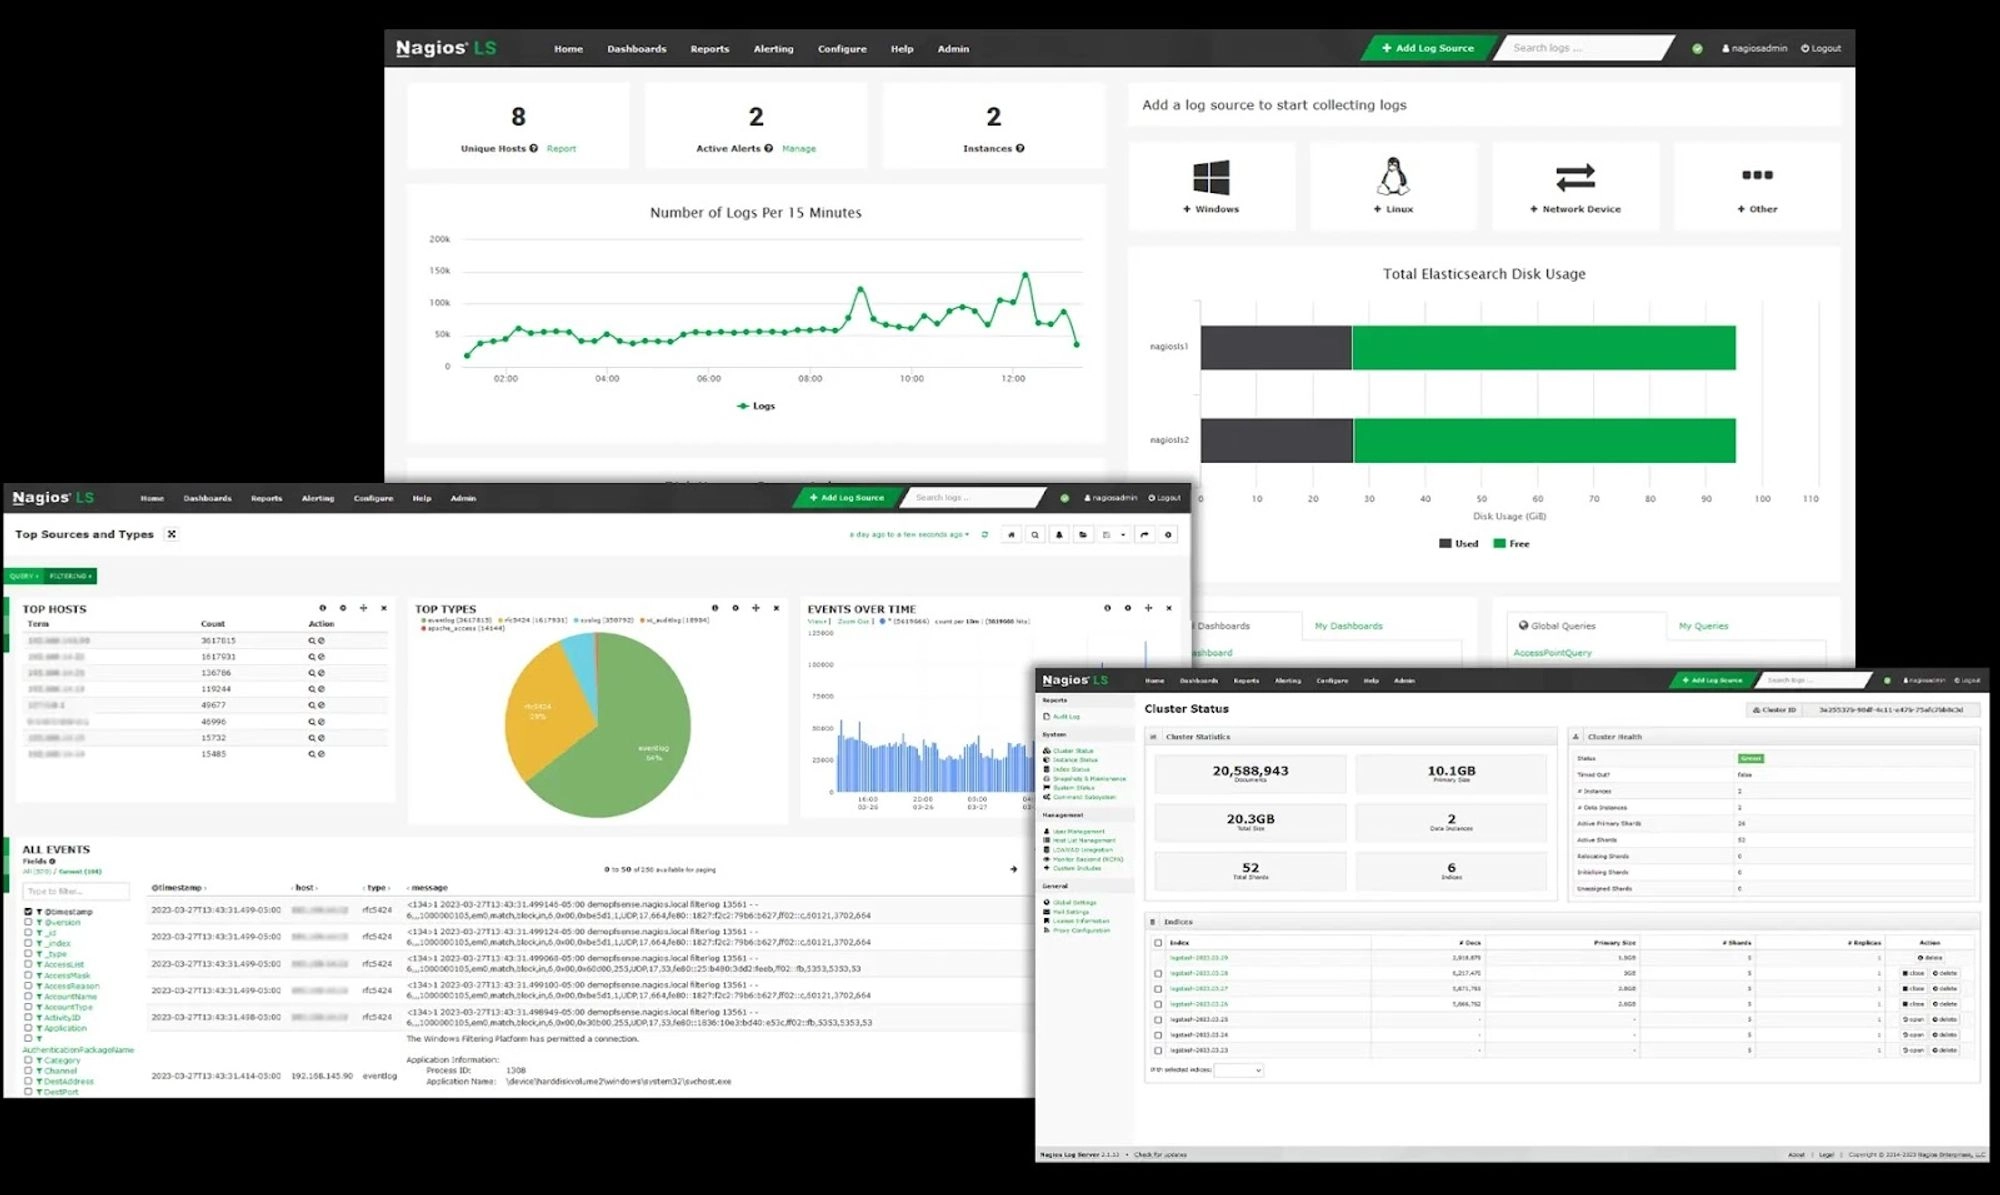
Nagios provides a flexible and extensible platform for monitoring system health, performance and uptime across networks, servers, and applications. Nagios has a plugin system via which it can be tailored to specific monitoring needs. Nagios has an open-source version (Nagios Core) and a paid version (Nagios XI). Though it has fewer and less advanced features, the open-source version, with its active community support, is a popular alternative to proprietary tools like AppDynamics.
Features
- Powerful script APIs for stress-free monitoring
- Event handlers for automatically restarting failed apps
- Customizable alerts and notifications to inform users about critical events
- Visualizations for tracking historical performance data and trends.
- Plugin architecture for easy extensibility
Pricing
Nagios Core is free to use while Nagios XI is available on a subscription basis with different pricing and feature offerings for the Standard, Enterprise, and Sitewide versions. The standard version costs a minimum of $2,495 per 100 nodes, the enterprise version a minimum of $4,490 per 100 nodes, while the Sitewide version offers customizable pricing and capabilities.
6. New Relic
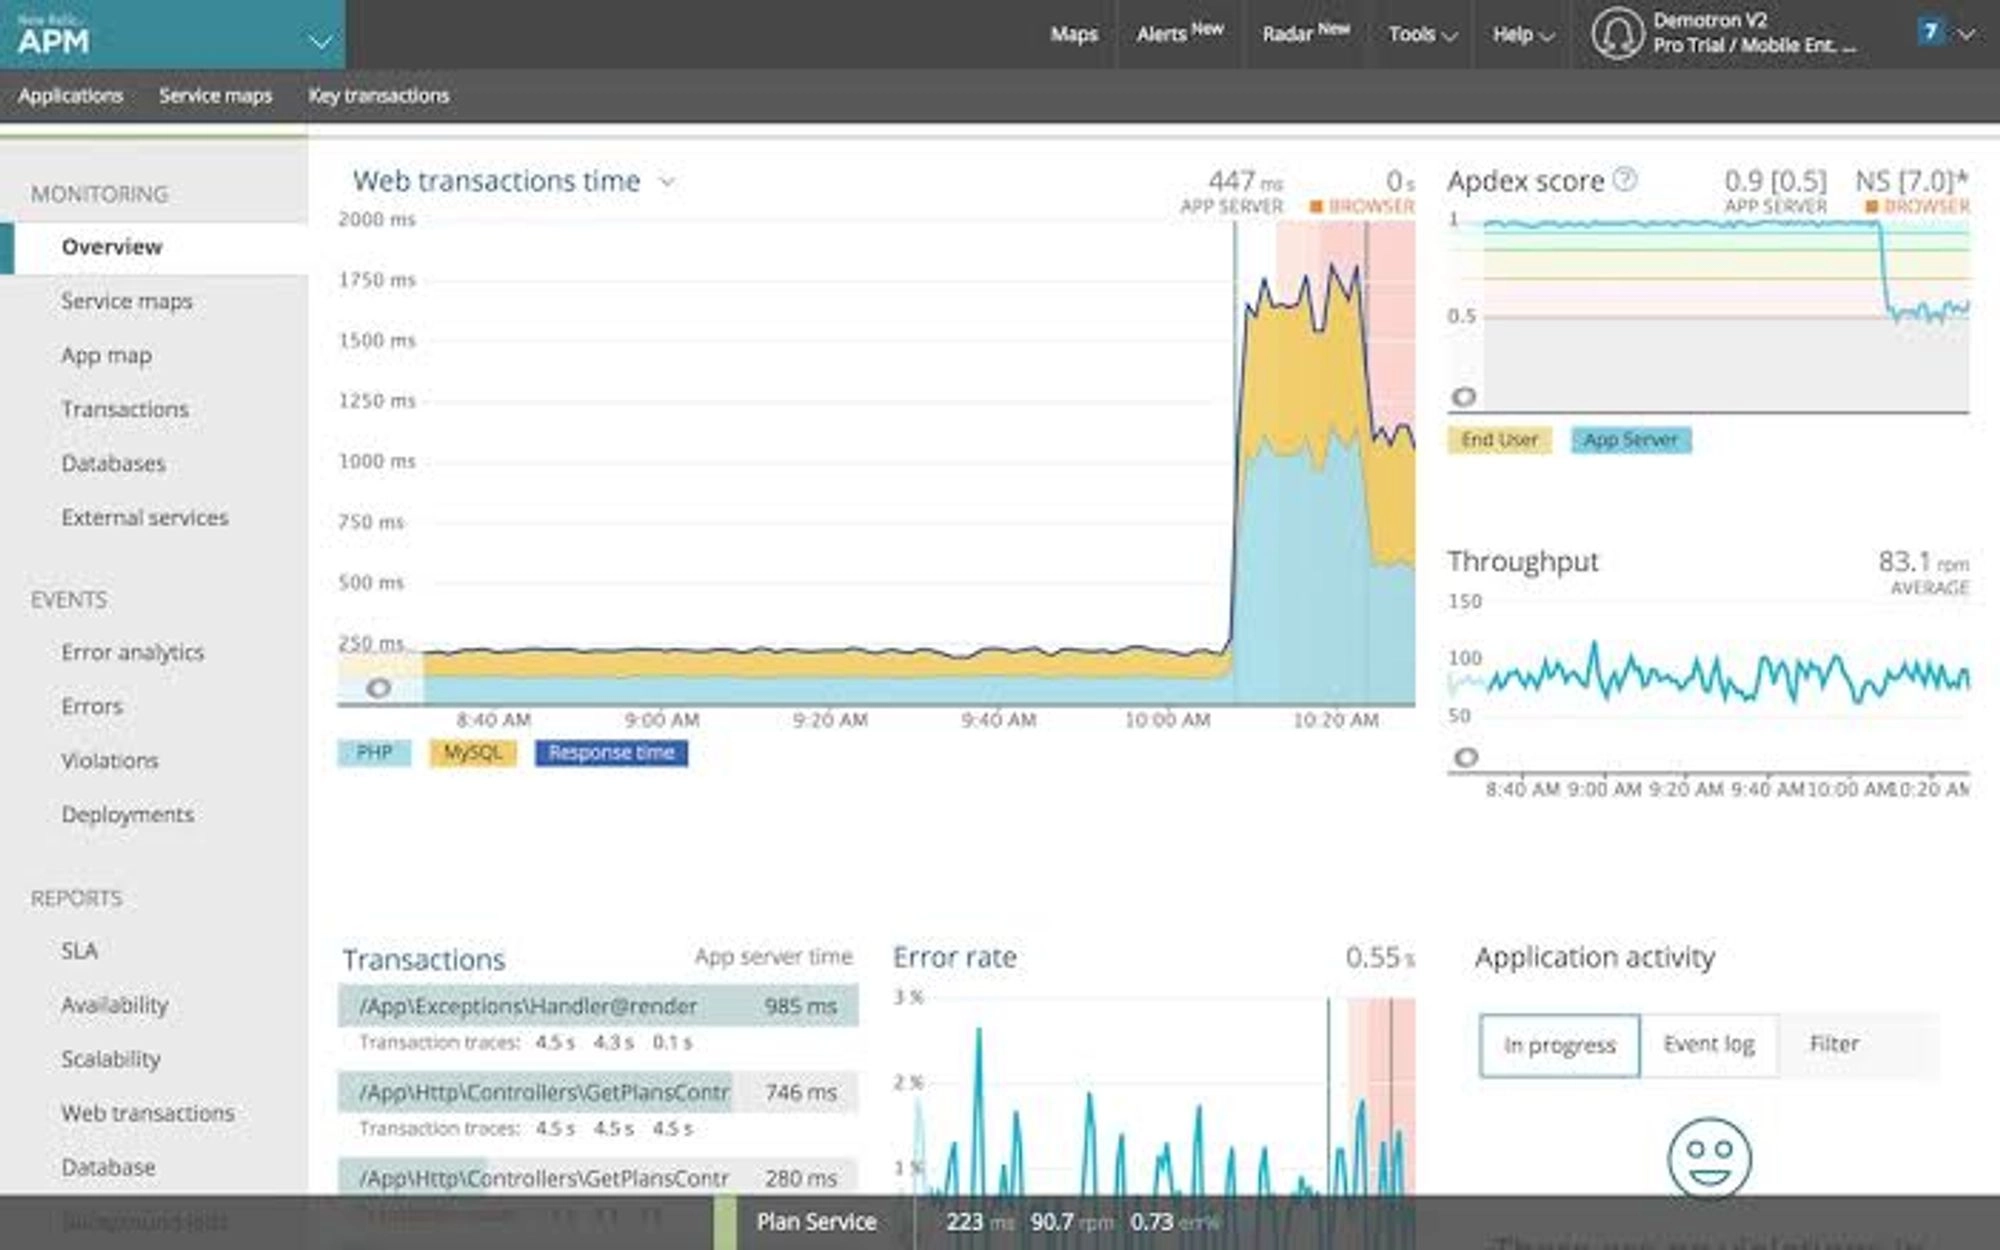
New Relic is a monitoring and analytics platform that provides insights into application performance with detailed metrics and visualizations so that you can quickly pinpoint and resolve any performance issues. Its ability to provide end-to-end monitoring across the stack makes it a strong competitor to AppDynamics.
Features
- Visualization for real-time monitoring
- 600+ integrations
- Server, container, database, user interaction and cloud infrastructure monitoring
- Interactive Application Security Testing (IAST)
- Code-level cluster monitoring
- Synthetic monitoring to simulate user journeys and identify issues
Pricing
New Relic offers a range of pricing plans based on the number of users and volume of data ingested per month. Alongside its free basic plan with limited features, it offers core and full platform options with more comprehensive features at varying prices.
7. Datadog
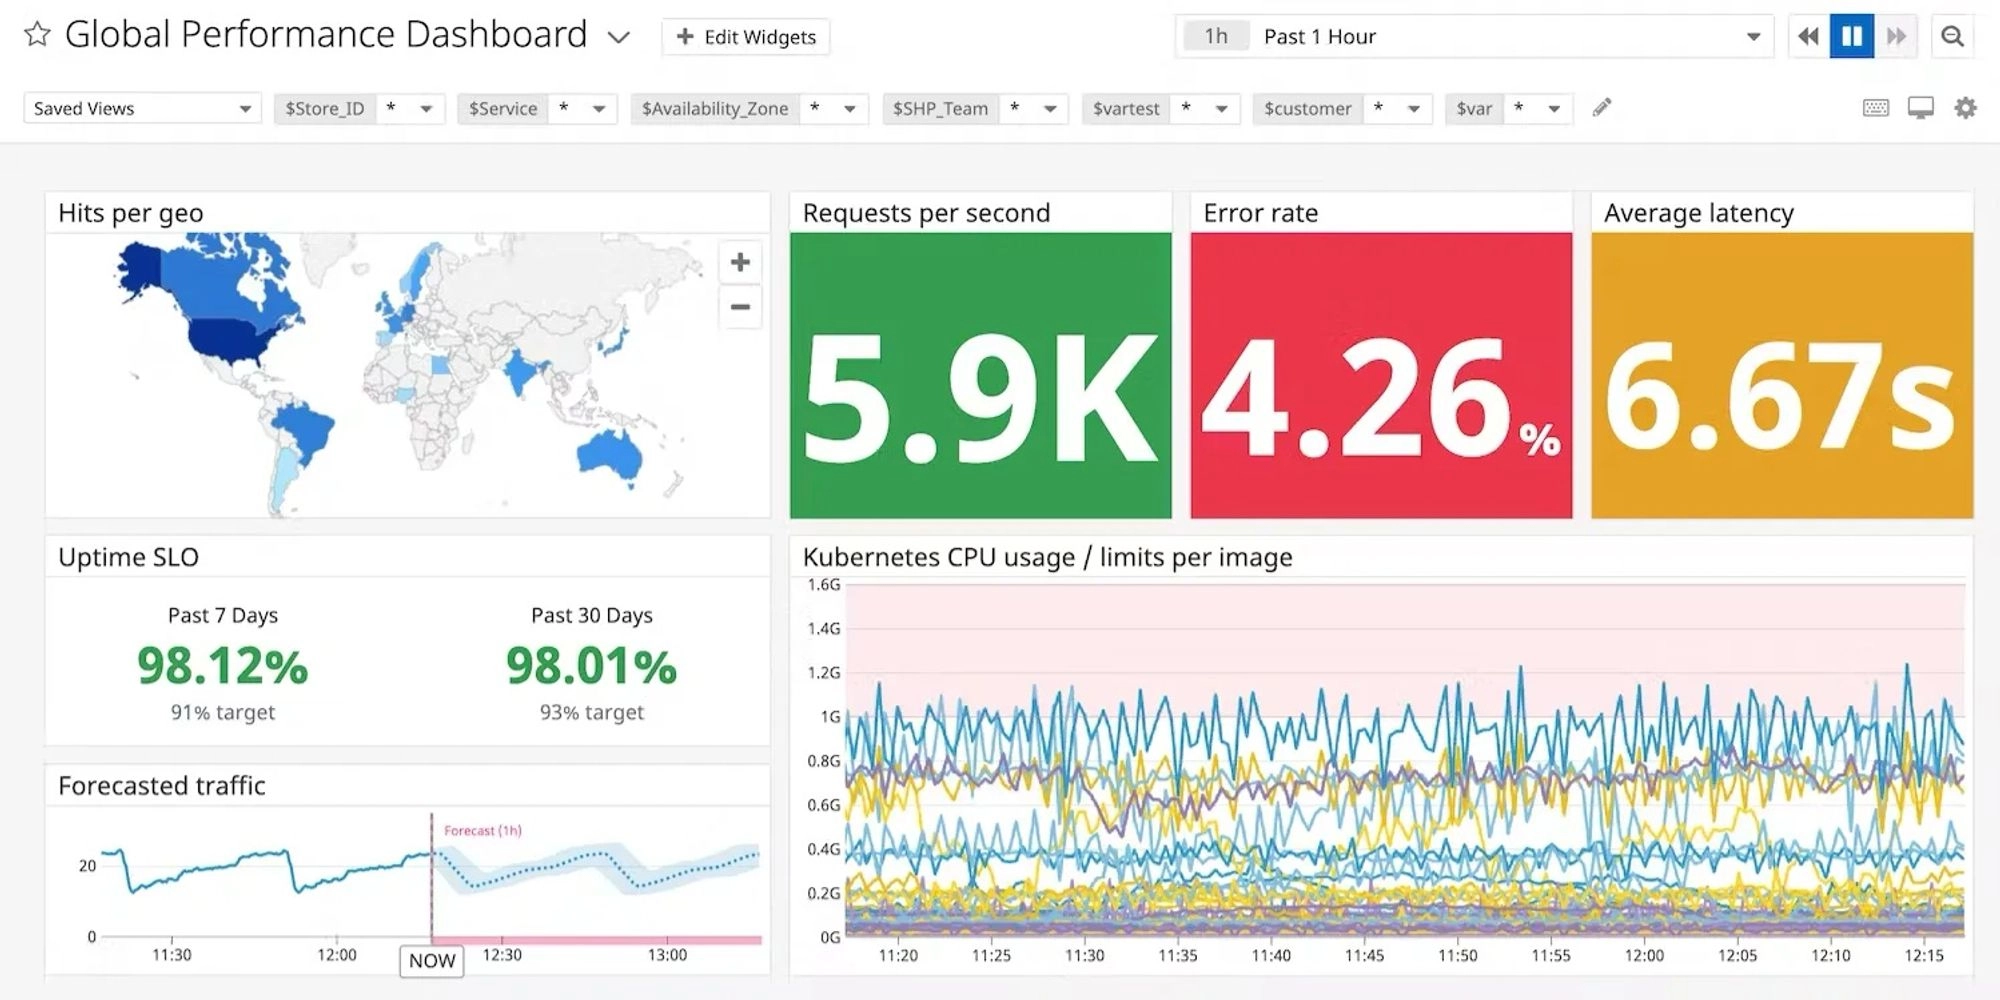
Datadog is a comprehensive monitoring and analytics platform that allows you to collect, visualize, and analyze data from different sources in real time. It allows you to find problems by connecting traces with different data sources like logs, metrics, queries, network activity, and user interactions, all in a single view. It also lets you filter and manage traces by keeping only the most significant ones using tags and criteria. Datadog’s strength, therefore, lies in its user-friendly interface and strong community support.
Features
- Custom dashboard for real-time insights
- Cloud SIEM
- Flexible log retention periods
- Serverless and real-user monitoring
- Log centralization for easy searching, analysis, and troubleshooting.
- Supports integration with a wide range of popular tools and services
Pricing
Datadog pricing is based on the features and volume of data you require. Infrastructure monitoring, application performance monitoring (APM), and database monitoring are billed on a per-host/per-month basis. Log management pricing is calculated per GB of uncompressed data ingested, compressed data scanned for rehydrating, and per GB per destination of outbound data.
8. Dynatrace
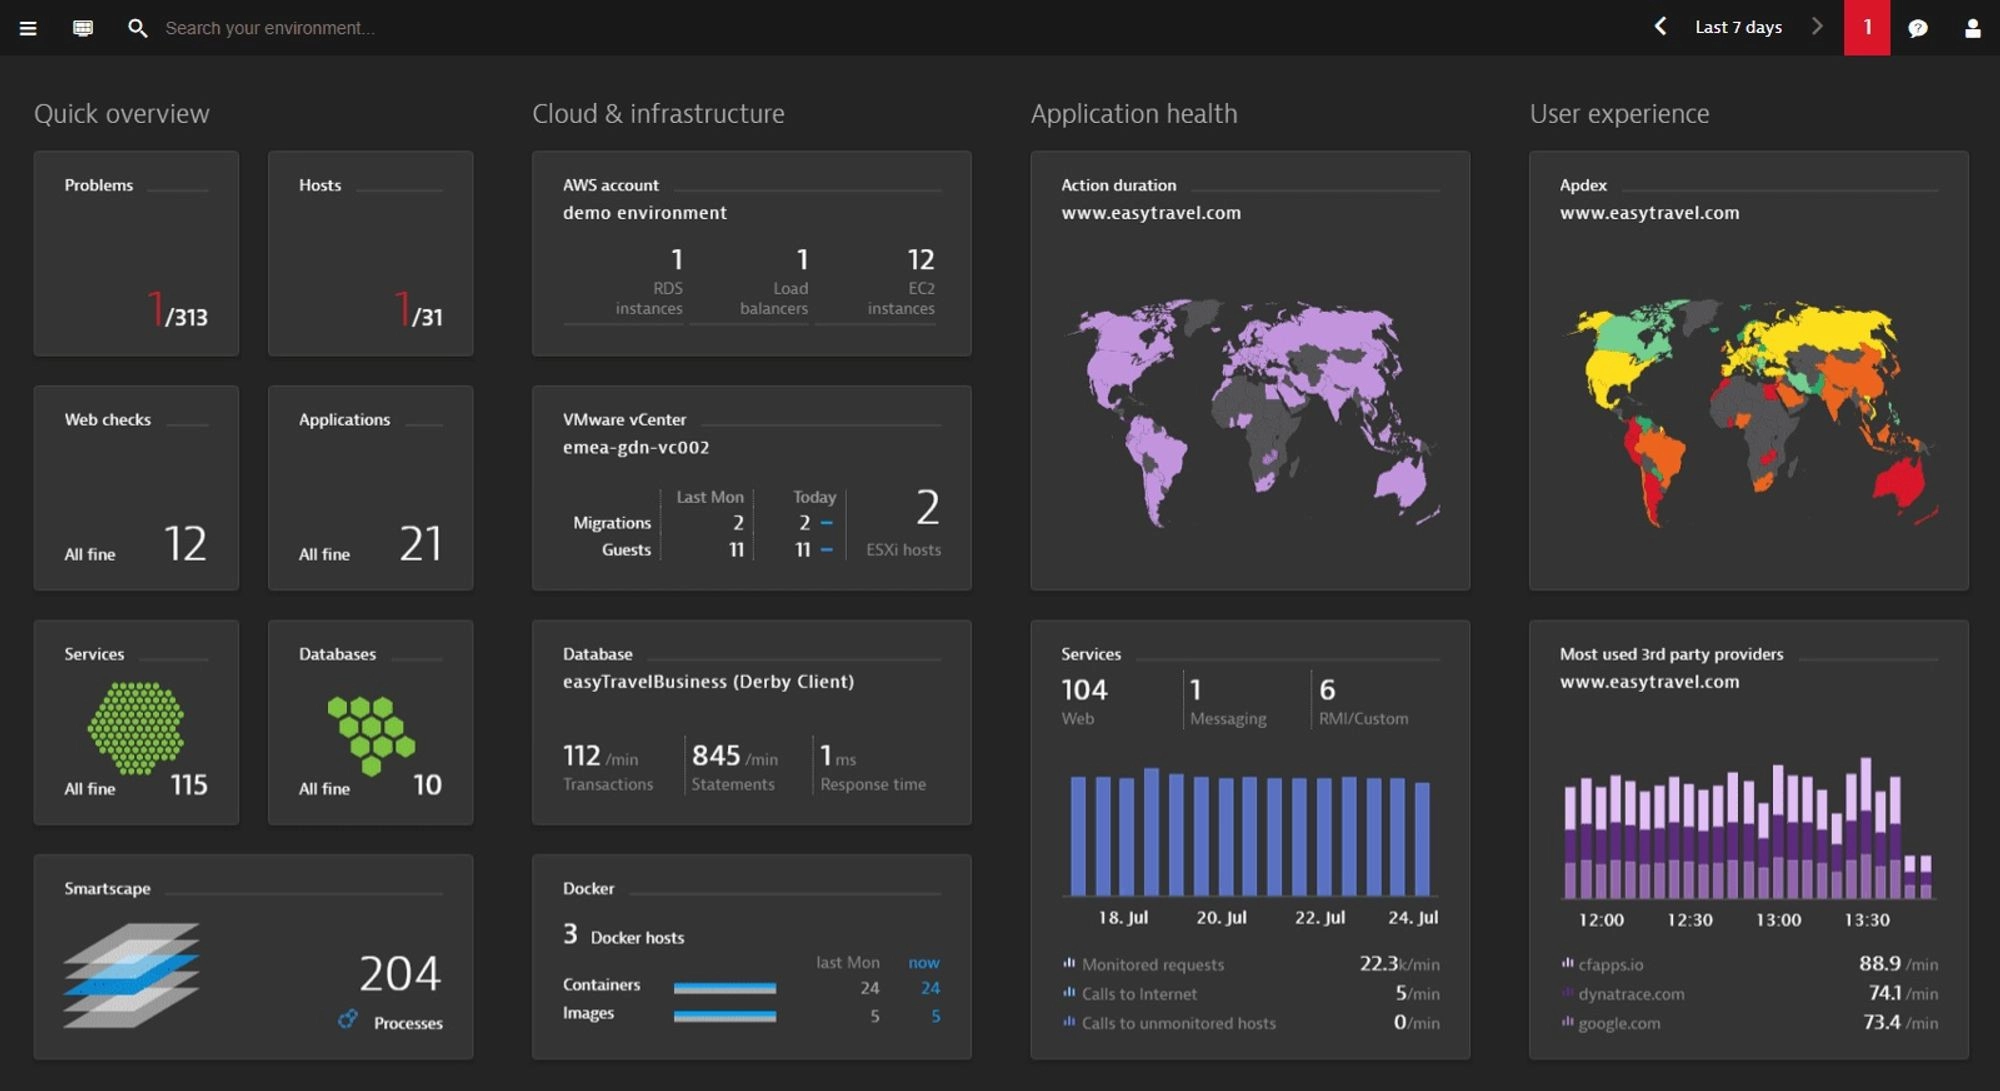
Dynatrace is an advanced monitoring and full-stack observability platform that utilizes artificial intelligence and automation to provide real-time insights into organizations’ entire stack. Dynatrace's focus on user experience and business impact sets it apart as a comprehensive monitoring solution and top Appdynamic alternative.
Features
- Several modules, including security analytics, business analytics, user experience monitoring, and synthetic monitoring
- Smartscape topology for real-time visual representation of app architecture and dependencies
- Automated risk analysis and impact assessment
- Custom offerings for various enterprise-level use cases
Pricing
Dynatrace's pricing model varies by module and is based on consumption, with pricing tiers determined by the volume of monitored entities, such as hosts or cloud instances, and the level of features required.
9. ManageEngine Applications Manager
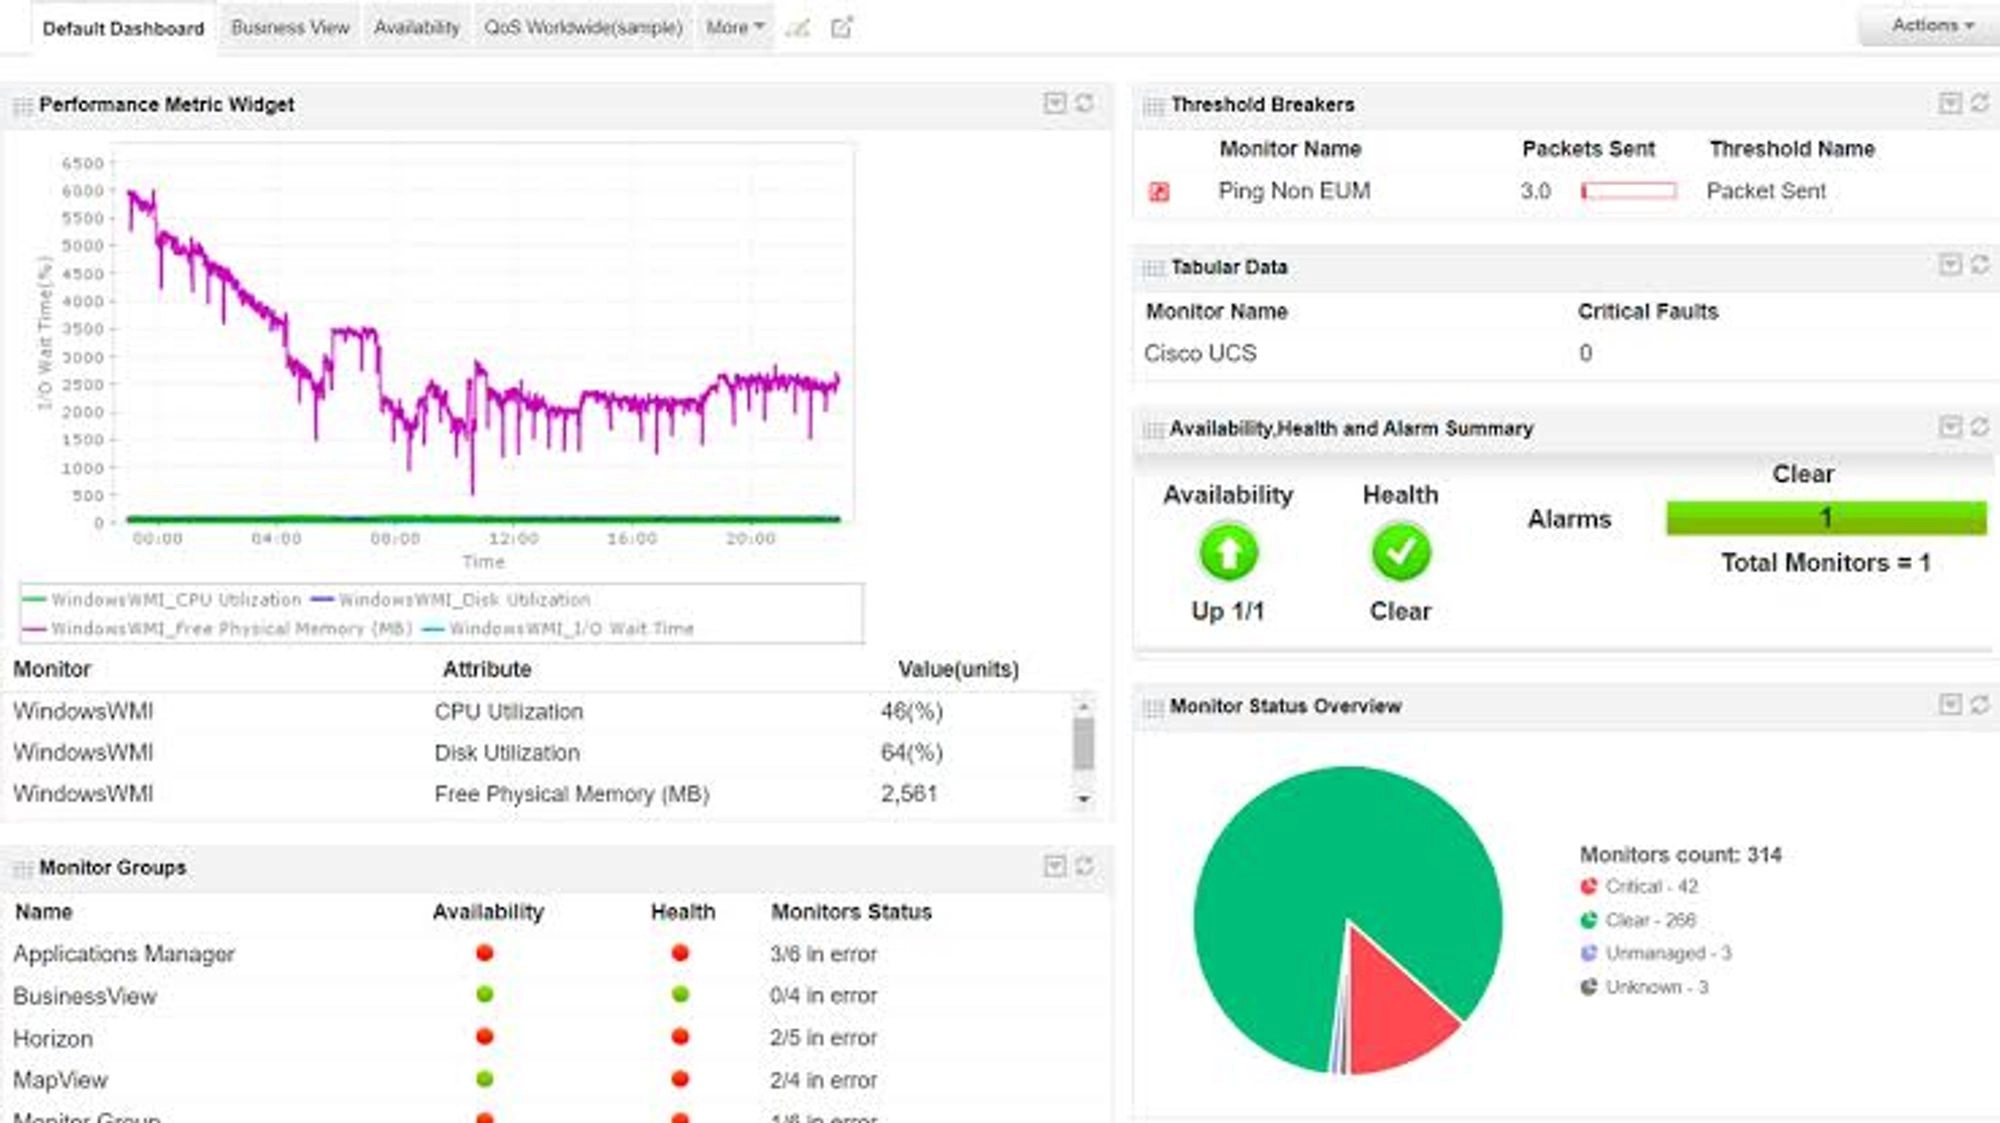
ManageEngine Applications Manager is a vast APM solution that offers server, database, Kubernetes, and synthetic transaction monitoring. ManageEngine Applications Manager is known for its user-friendly interface, relatively affordable pricing model, and ease of setup, which make it a competitive alternative to the more expensive AppDynamics.
Features
- Tracks user interactions with applications to provide insights into user experience and behavior.
- Monitors server performance metrics—such as CPU usage, memory utilization, and disk space—to ensure server health.
- Provides customizable dashboards and reports for visualizing and analyzing performance data.
Pricing
ManageEngine Applications Manager offers a flexible pricing model based on the number of monitors (application instance, server, service, or URL) monitored per user. The platform provides a free tier with limited offerings, and enterprise and professional plans with annual subscription and licensing options.
Conclusion
The tool you choose for monitoring your application and infrastructure plays a pivotal role in ensuring system reliability and optimal performance. We, of course, would suggest you to evaluate SigNoz as an alternative to Appdynamics.
It is an open-source observability tool that provides three signals in a single pane. OpenTelemetry is quietly becoming the world standard for cloud-native application instrumentation, and SigNoz is the top choice for an OpenTelemetry APM.
Further Reading

