7 Open-Source Log Management Tools that you may consider in 2024
Effective log management is a fundamental aspect of maintaining and troubleshooting today's complex systems and applications. The sheer volume of data generated by various software and hardware components can make it challenging to identify and resolve issues in a timely manner.

Open-source log management tools offer a cost-efficient and customizable approach for collecting, analyzing, and visualizing log data. These tools empower administrators with the ability to swiftly discern patterns and trends within log data, thereby streamlining the diagnosis and resolution of problems.
In this article, we will take a closer look at some of the most popular open-source log management tools available and explore the features and capabilities of each tool. Whether you are a system administrator, developer, or security professional, this article will provide you with the information you need to choose the best log management solution for your needs.
Top 7 open-source log management tools
In this section, we will discuss the top 7 open-source log management tools that have been adopted by organizations. They are:
SigNoz
SigNoz is a comprehensive, open-source log management and analysis platform that offers a centralized location for the collection, storage, and analysis of log data. Designed to aid organizations in gaining valuable insights into their IT infrastructure, applications, and security, the platform offers real-time visibility, automated troubleshooting, and predictive analytics.
SigNoz supports the collection of log data from a wide range of sources, including servers, network devices, applications, and cloud services. It uses OpenTelemetry to collect and process log data. OpenTelemetry has quietly become the world standard for instrumenting cloud-native applications.
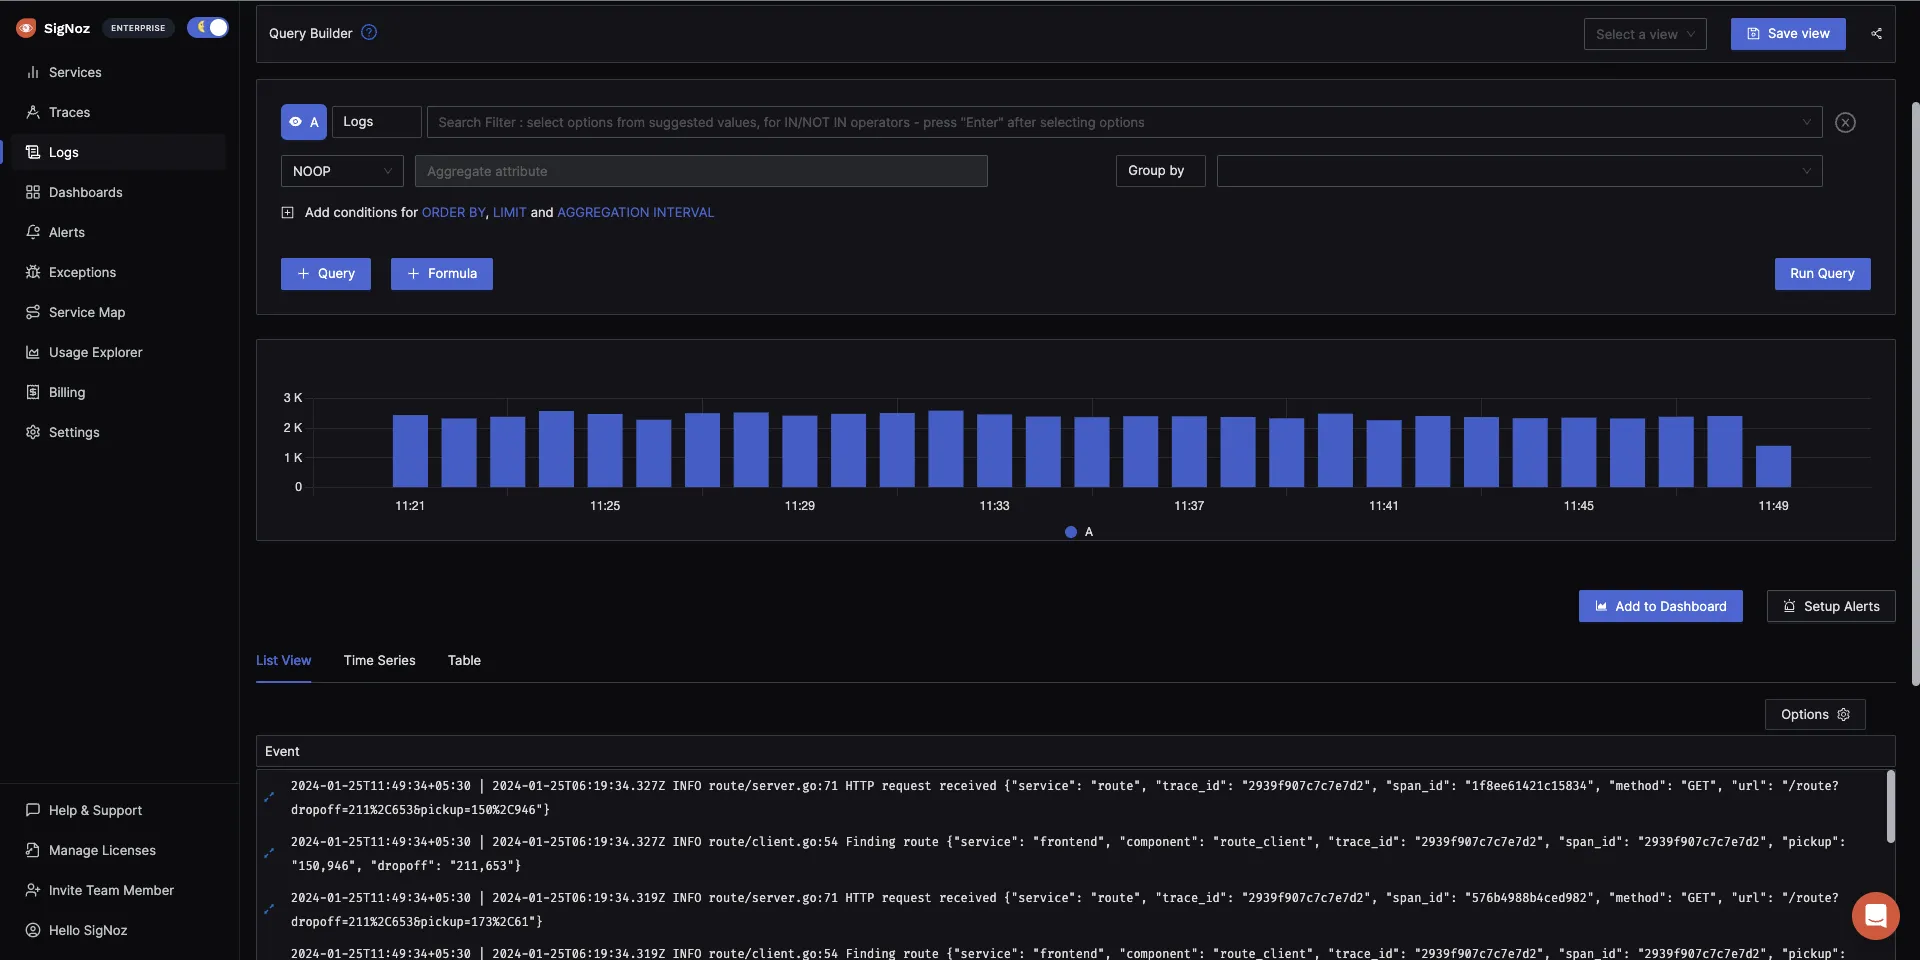
The platform also offers a variety of visualization options, such as charts, graphs, and maps, to aid users in gaining insights into their log data.
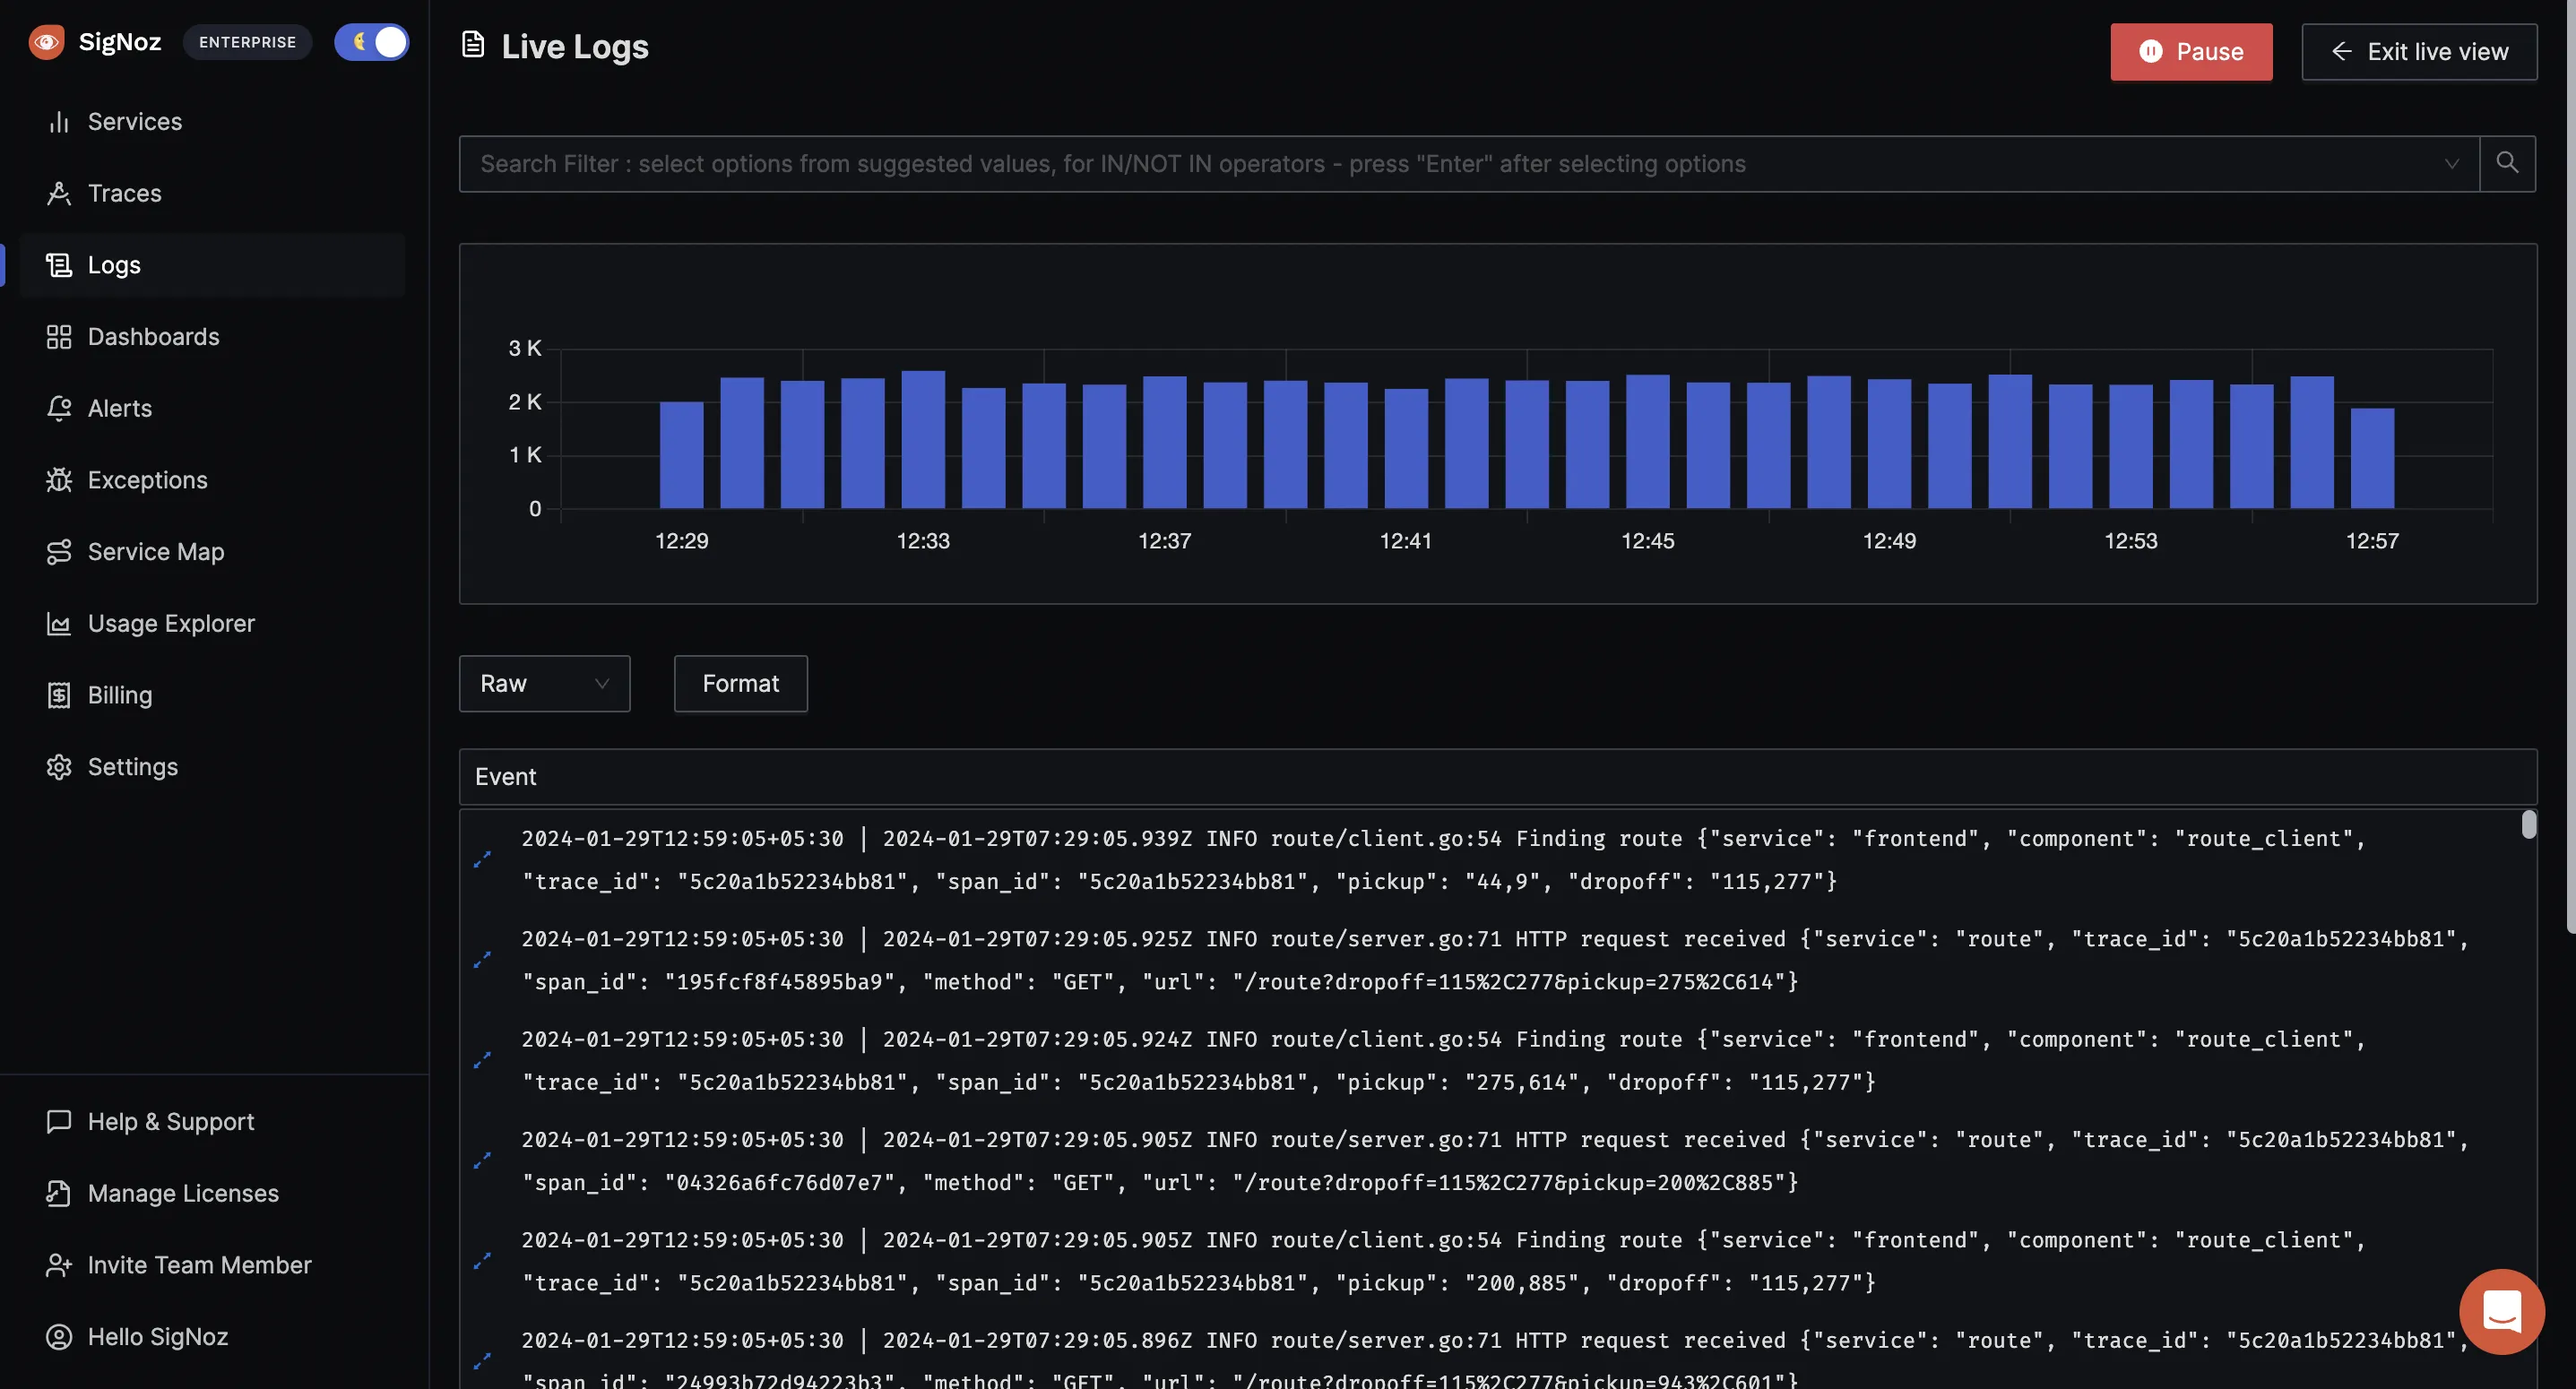
Furthermore, it provides automated alerting and troubleshooting features, enabling organizations to identify and resolve issues quickly.
Some key features of SigNoz are:
- Log data collection and analysis
- Centralized data storage
- Real-time visibility
- Data visualization
- Alerting and troubleshooting
- Support for integration with other tools and systems
You can read more about SigNoz from its documentation.
Logstash
Logstash is a powerful, open-source log management tool that is part of the Elastic Stack (previously known as the ELK stack). Logstash is capable of collecting and processing logs from a wide range of sources and can output them to a variety of destinations, including Elasticsearch, a search engine, an analytics engine, or a file.As a log management tool, Logstash provides a pipeline for collecting, parsing, and processing log data. It ingests log data from various sources, such as files, Syslog, and network inputs, and can parse and process the data using a variety of filters and plugins.
Capable of handling high volumes of data and heavy loads while maintaining good performance, Logstash can be run as a standalone service or as a distributed system. Logstash itself does not have a built-in dashboard for viewing logs.
However, it can be used in conjunction with other tools such as SigNoz and Kibana to create and share interactive visualizations and dashboards of log data collected by Logstash. You can find docs on how to send data collected by Logstash to SigNoz here.
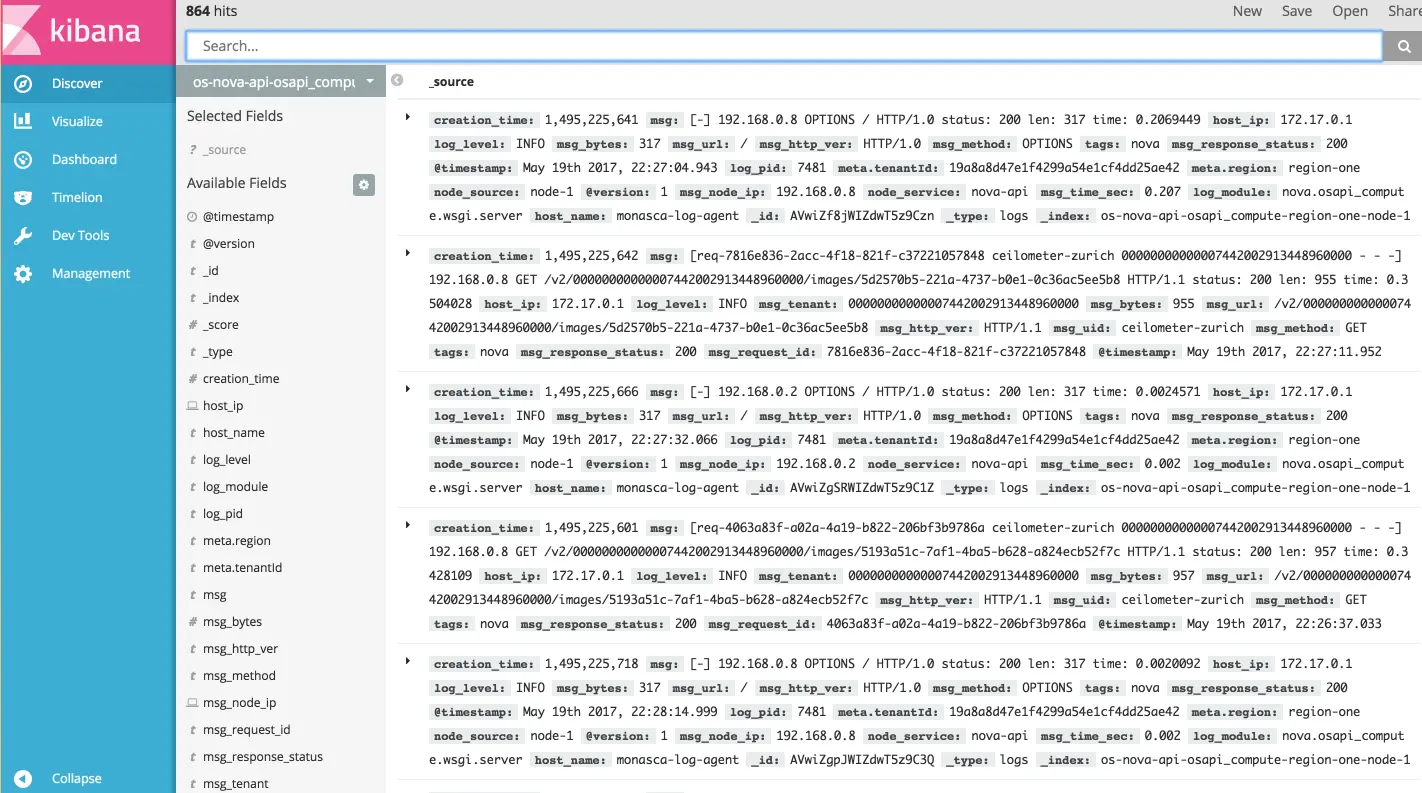
Some key features of Logstash are:
- Log data collection from various sources
- Parsing and processing of log data
- High performance and scalability
- Output to various destinations
- Multiple platforms support
- Integration with other ELK stack components
- Built-in security features.
Graylog
Graylog is an open-source log management and analysis platform designed to collect, store, and analyze large volumes of log data from various sources. Utilizing a pipeline system for data collection and processing, Graylog collects data from various sources, parses, transforms, and enriches it before storing it in a database, allowing for easy searching and analysis via the Graylog web interface, which provides a wide range of visualization options.In addition to its robust data collection and processing capabilities, Graylog also offers alerting capabilities, sending notifications when specific conditions are met such as the encounter of a particular error message. The platform also provides a RESTful API for integration with other tools and systems and can handle large volumes of log data, scaling horizontally by adding more Graylog server nodes to a cluster.
Graylog supports multiple data inputs and outputs, it can collect data from various sources such as Syslog, GELF, log files, and Windows Event Log, and it can output data to other systems such as Elasticsearch, Apache Kafka, and more.
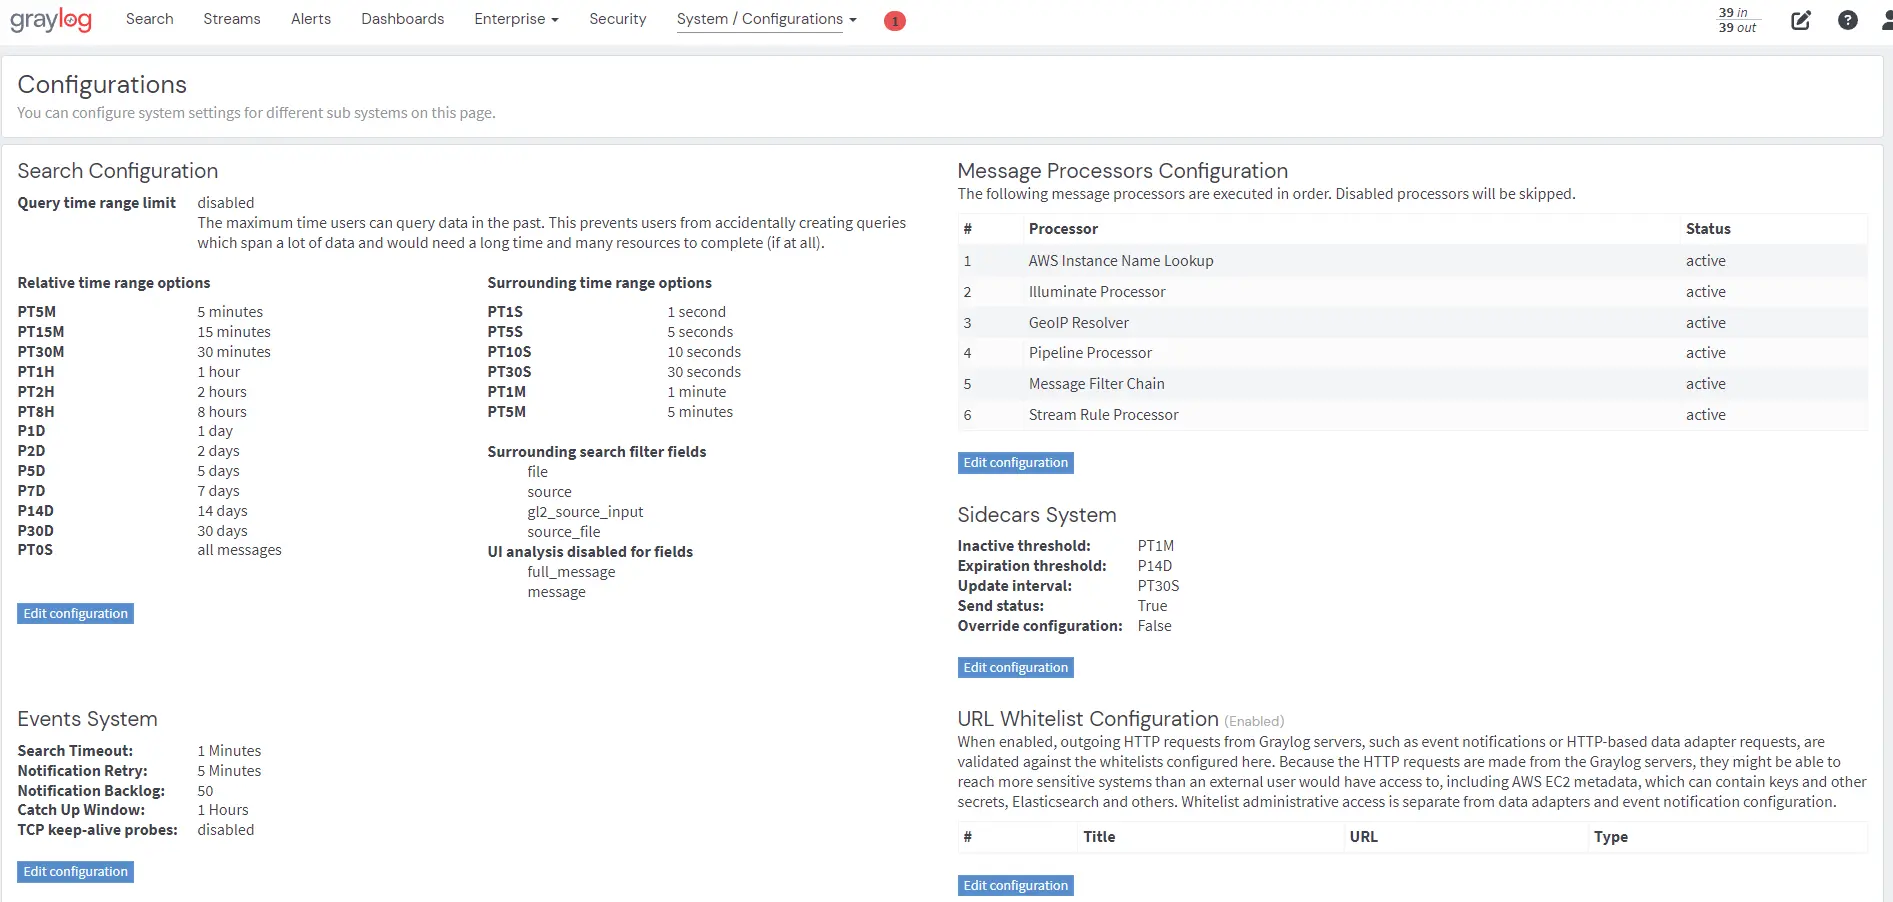
Some key features of Graylog are;
- Log data collection and analysis
- Data processing pipeline
- Search and analysis capabilities
- Alerting and notifications
- RESTful API
- Scalability
- Multi-data inputs and outputs
FluentD
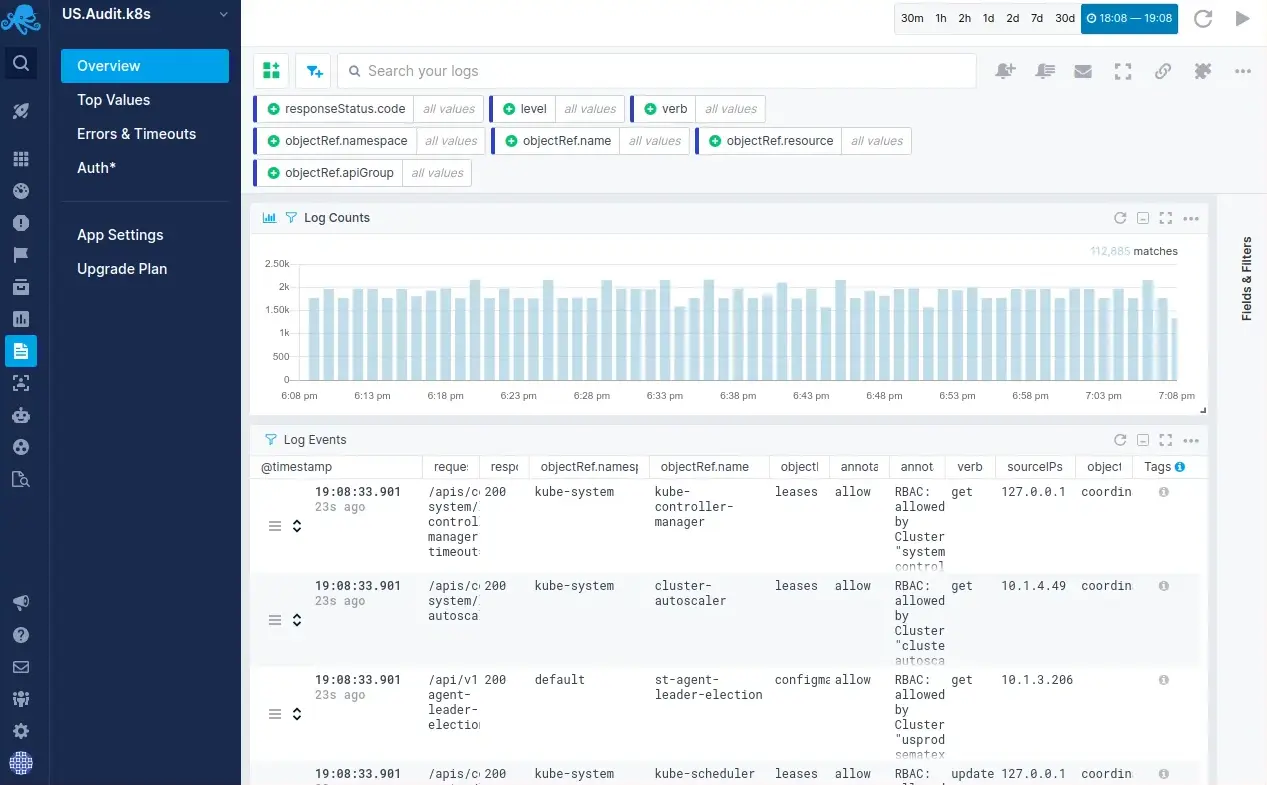
Fluentd is a powerful log management tool that offers organizations the flexibility and scalability required to handle large volumes of log data from a variety of sources and transport it to various destinations. Utilizing a flexible and modular architecture, Fluentd allows users to easily add new input and output plugins to integrate with a wide range of systems and applications. It supports a wide range of data sources and destinations, including databases, message queues, and data stores.Fluentd has a built-in buffering mechanism that enables it to handle temporary failures in the output destination, ensuring that data is not lost. Users can filter, buffer and format log data using the built-in filters and parsers before sending it to the output destinations.
Some key features of FluentD are:
- Log data collection and transport
- Flexible and modular architecture
- Input and output plugins
- Variety of data sources and destinations
- Built-in security features
- Filtering, buffering, and formatting of log data
Syslog-ng
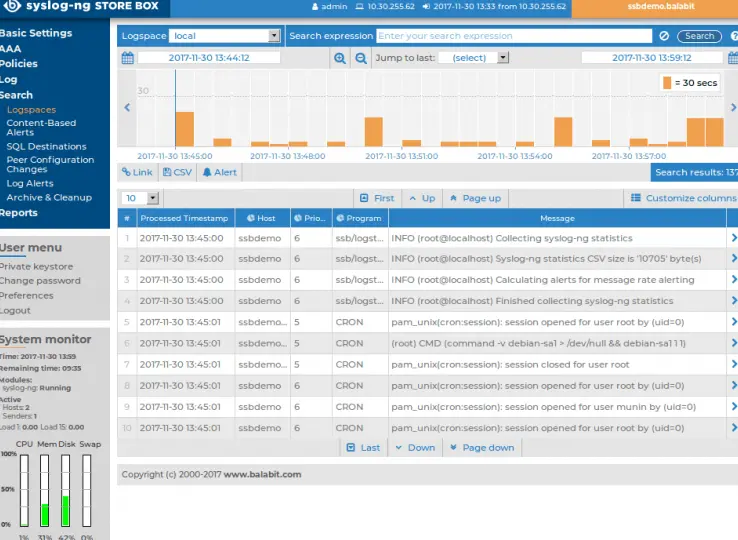
Syslog-ng is an open-source log management tool designed for the collection, parsing, and transportation of log data from various sources to a wide range of destinations. Known for its flexibility and wide range of features and capabilities, such as filtering, parsing, rewriting, and alerting, Syslog-ng is a widely used tool in Linux and Unix-based systems for log management.Syslog-ng is capable of collecting log data from a diverse array of sources, including Syslog, GELF, log files, and Windows Event Log. It can parse, filter, and rewrite log messages before forwarding them to other systems, such as databases, message queues, and data stores.
The tool offers a large number of built-in destination and source drivers for popular data destinations, including Elasticsearch, Apache Kafka, and more, allowing for easy integration with other systems. Additionally, Syslog-ng includes a built-in buffering mechanism that enables it to handle temporary failures in the output destination and ensures that data is not lost.
Some key features of Syslog-ng are;
- Log data collection and transport
- Flexible filtering and parsing capabilities
- Built-in source and destination drivers
- A large number of input and output plugins
- Built-in buffering mechanism
- Support for various log formats and protocols.
Logwatch
Logwatch is an open-source log analysis tool designed to automatically parse and analyze log files from various services and applications running on Linux or Unix-based systems. It presents a summary of the log data, including system activity, security events, and potential issues in a detailed, easy-to-read format, making it simple to identify and troubleshoot problems.Logwatch utilizes a series of customizable filter scripts, written in Perl, to parse log data from various services and applications, such as Apache, SSH, and Syslog. These scripts can be modified to meet the specific needs of an organization. Additionally, Logwatch offers various options for controlling the output, including the ability to filter out specific log entries, adjust the level of detail, and send the output to a specific email address or file.
Logwatch is typically run on a daily basis and can be scheduled to run automatically using cron or another scheduling tool. It also offers a command-line interface, which allows users to run Logwatch and view the output directly on the command line.
Some key features of Logwatch:
- Log data analysis
- Customizable filter scripts
- Detailed and easy-to-read output
- Output filtering and control
- Email and file output
- Scheduled and command-line execution
- Summary of system activity, security events, and potential problems
- Ability to filter out specific log entries
Apache Flume
Apache Flume is an open-source log management tool designed to efficiently collect, aggregate, and transport large volumes of log data from various sources to a centralized data store, such as HDFS or Hbase. It excels in handling large amounts of log data in real-time and is highly scalable, able to handle the load from multiple servers, network devices, and applications.In terms of log management, Apache Flume offers features such as data collection, transportation, aggregation, fault tolerance, and delivery guarantee. It also boasts a plugin-based architecture, allowing organizations to easily add new sources and sinks as needed, facilitating integration with other log management tools and systems, and enabling the addition of new log sources. Additionally, it is straightforward to set up and configure and provides a web-based interface for monitoring and managing log data.
Some key features of Apache Flume are;
- Log data collection and transportation
- Data aggregation
- Centralized data storage
- Fault-tolerance and delivery guarantee
- Scalable
- Plugin-based architecture
- Web-based interface
- Real-time log data processing
- Integration with other log management tools and systems
Choosing the right Log Management Tool
When choosing a log management tool, it is important to consider factors such as data collection, ingestion, and processing capabilities. You should consider scalability, security features, integration with other tools and systems, user interface, and visualization options. Based on these factors, you can choose a log management tool that fit your use cases.
If you are looking for an open source log management tool that solves most of your monitoring needs, then SigNoz can be a good choice. It provides logs, metrics, and traces under a single pane of glass with an intelligent correlation between the three types of telemetry signals.
SigNoz is open-source and cost-effective for organizations. It is built to support OpenTelemetry natively. With the flexibility and scalability of OpenTelemetry and SigNoz, organizations can monitor and analyze large volumes of log data in real-time, making it an ideal solution for log management.
Getting started with SigNoz
SigNoz can be installed on macOS or Linux computers in just three steps by using a simple install script.
The install script automatically installs Docker Engine on Linux. However, on macOS, you must manually install Docker Engine before running the install script.
git clone -b main https://github.com/SigNoz/signoz.git
cd signoz/deploy/
./install.sh
You can visit our documentation for instructions on how to install SigNoz using Docker Swarm and Helm Charts.
If you liked what you read, then check out our GitHub repo 👇
Related posts


